Configuring the Proposition Distribution reports is required to show how the business is performing.
Task ID
Task-060101
Primary role
Senior Decisioning Architect
Secondary role
N/A
Tertiary role
N/A
The Proposition Distribution chart shows the portfolio coverage - that is, the number of actions which were initiated for your customers over a specific time period. Edit this report to change the reporting period, adjust the grouping of data in the report, or filter out data about specific action groups.
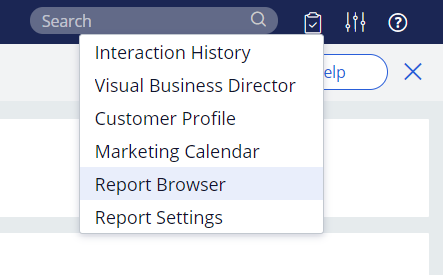
In the Pega Marketing portal, click Reports > Report Browser, as in the following figure:
Accessing the Report Browser
In the Public categories list, select Interaction History.
Click the Proposition Distribution report.
The report shows the number of initiated actions as a bar chart. The same information is also available below in the form of a table. By default, the report is filtered to only include results from the past 30 days, as in the following figure:
Default time period for the Proposition Distribution report
Click Edit report.
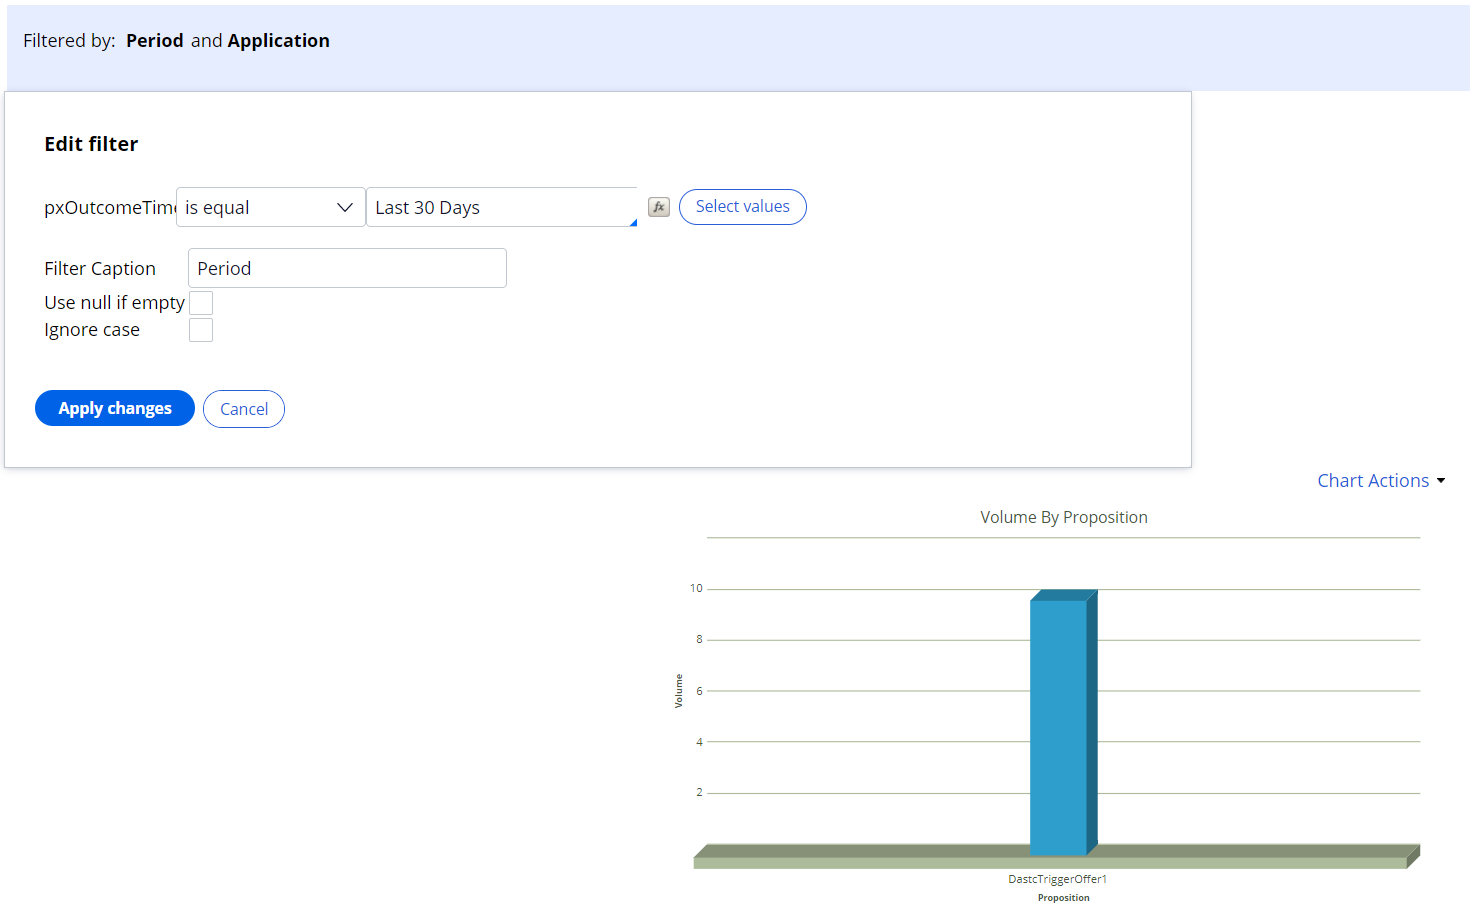
To change the time frame for the report, for example, from monthly to weekly, in the Filtered by section, click Period, and then click Select values.
Edit the report configuration to group the actions by the issue to which the action belongs.
Click Edit chart.
Click Delete to remove the default grouping by action ID, as in the following figure:
Removing the default grouping
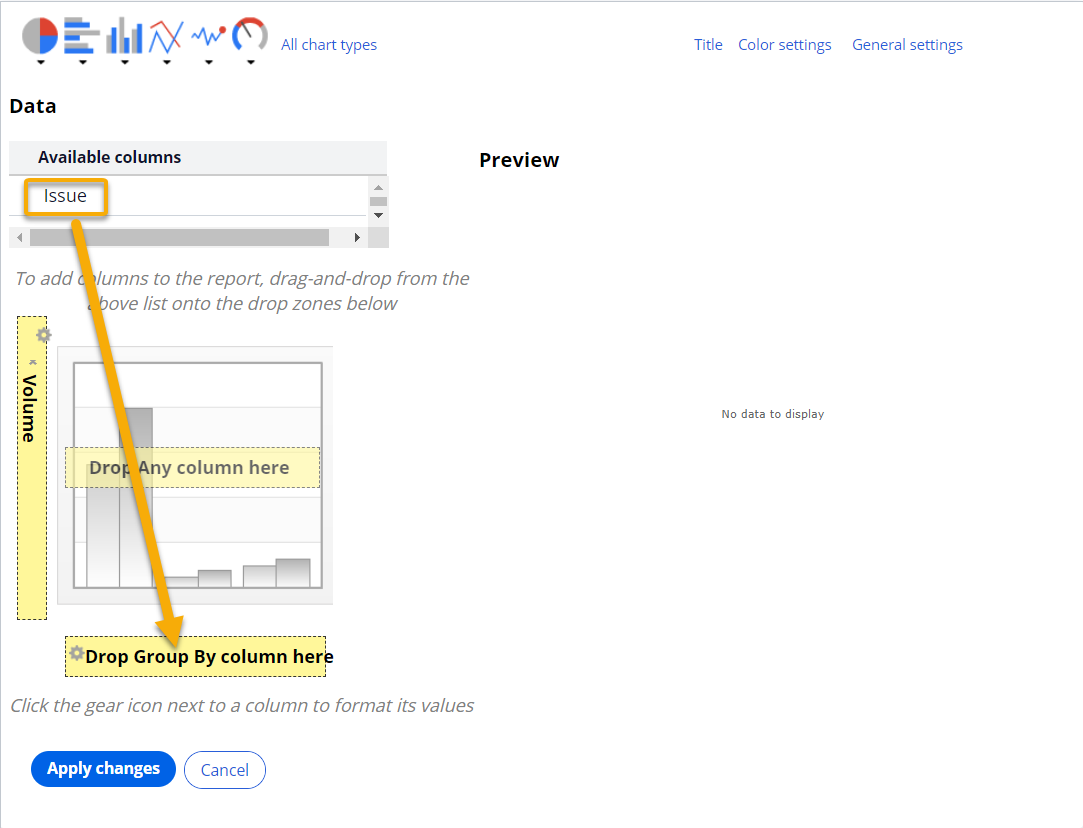
Drag and drop the Issue column from the Available columns table to the Drop Group By column here section, as in the following figure:
Grouping the report results by issue
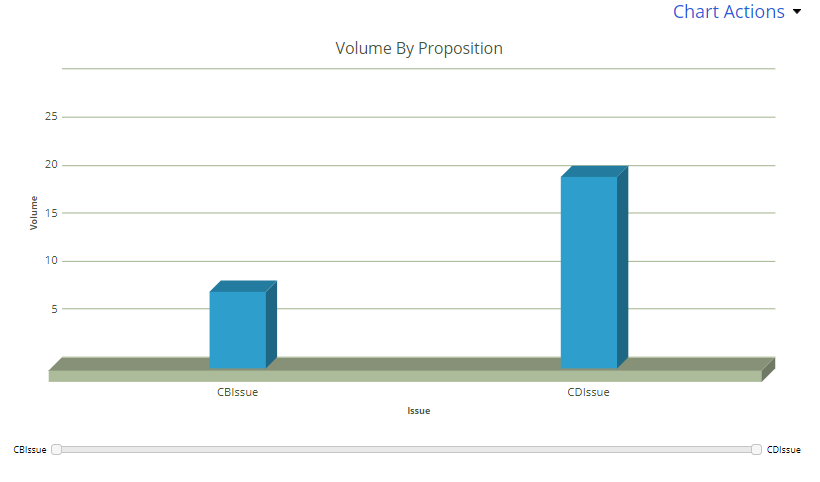
The report now displays action volume grouped and aggregated by issue to which the actions belong, as in the following figure:
Sample report grouped by issue
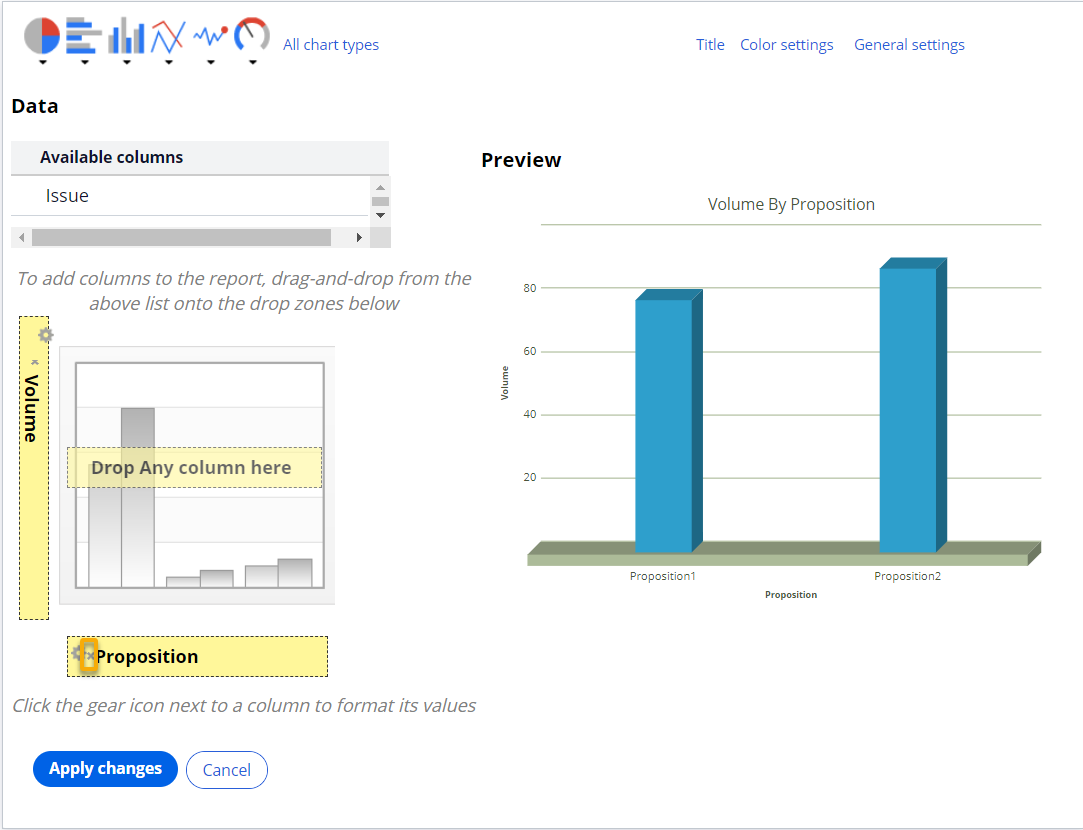
To see the results for individual actions within each issue, drag and drop the Proposition column from the Available columns table to the Drop Any column here section.
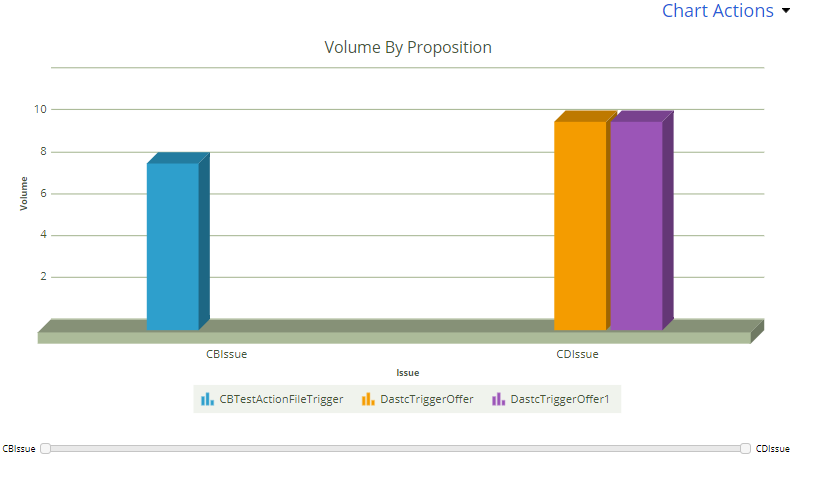
The report now displays the results for individual actions, as in the following figure:
Sample results grouped by issue and action ID
Configure the report filters to exclude irrelevant results.
For example, if your Next-Best-Action business structure includes an issue which represents service messages and regulatory communications, actions related to this issue should be excluded from the results of this report, as they do not represent your marketing portfolio items.
In the Data Explorer section of the report, find the item which corresponds to the type of data that you want to filter out.
For example, to find the Issue item, click More > Action Dimensions > Issue.
Drag and drop the item into the Filtered by section of the report.
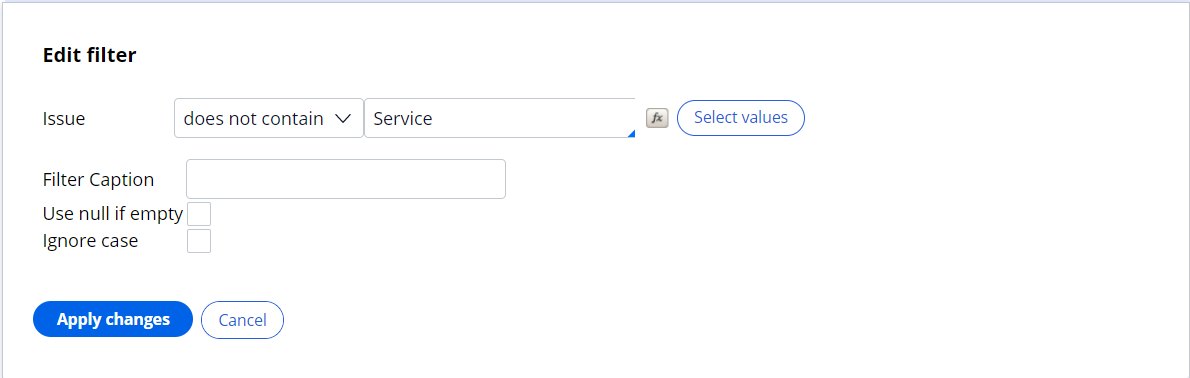
Edit the filter settings, as in the following figure:
Filtering out actions related to the Service issue
Click Apply changes.
Click Preview.
Click Actions > Save as and enter a new name for the report, for example, Portfolio coverage by action and issue.
Click Done editing.
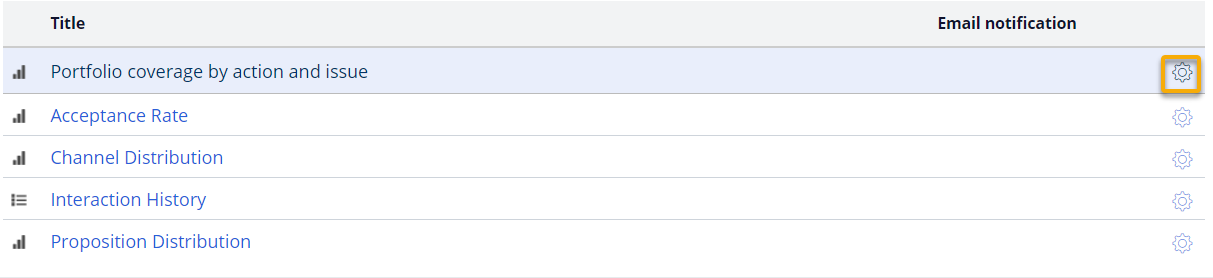
The new report is now available in the Report Browser.
To automatically export the report results and send them out by email, schedule a reoccurring task.
Click Take action on report, as in the following figure:
The Take action on report icon
Click Schedule.
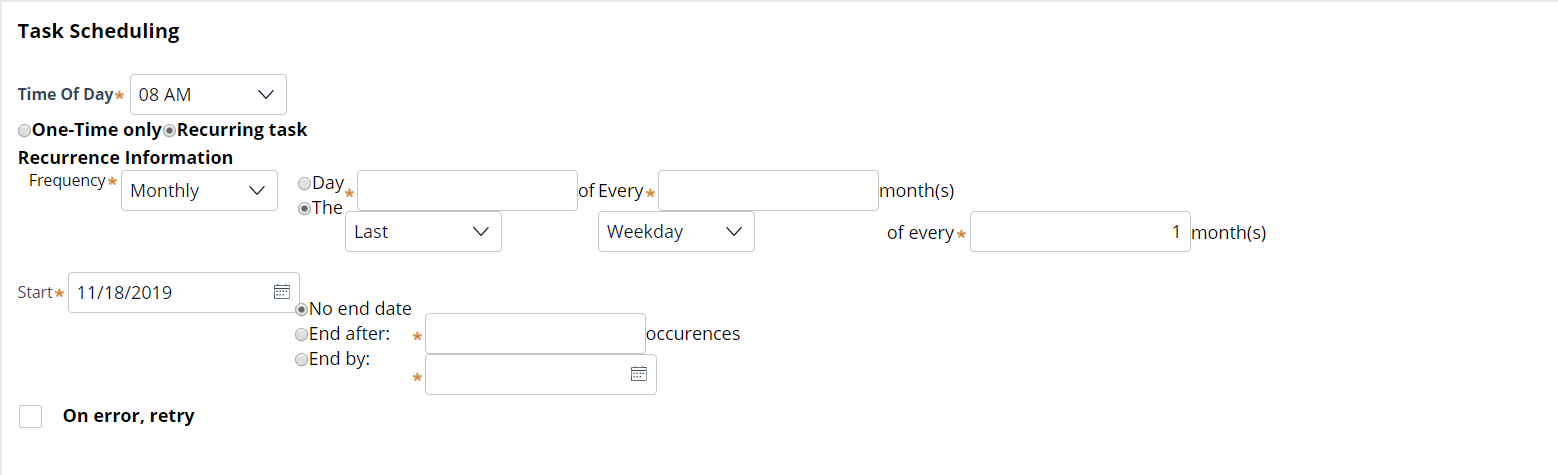
In the Task Scheduling section, configure when the report should be sent out, as in the following figure:
Sample report schedule
In the Task Output Processing section, select the file format and recipients for the report.
You can only send the report to users who have operator accounts in Pega Marketing.