This documentation site is for previous versions. Visit our new documentation site for current releases.      
 

Queue Processor landing page in Pega Predictive Diagnostic Cloud

Updated on July 26, 2021

Check usage statistics and detailed information about the status of the queue processor.

On the Queue Processor landing page, you can find the following types of information:

  • Metrics summary – The total number of queue processors, the number of running and disabled queue processors, and the number of broken items.
  • Queue processor details – Current and historical information about the status of the queue processors, such as the class, node type, and statistical data.
    You can export the data to an .xlsx file.
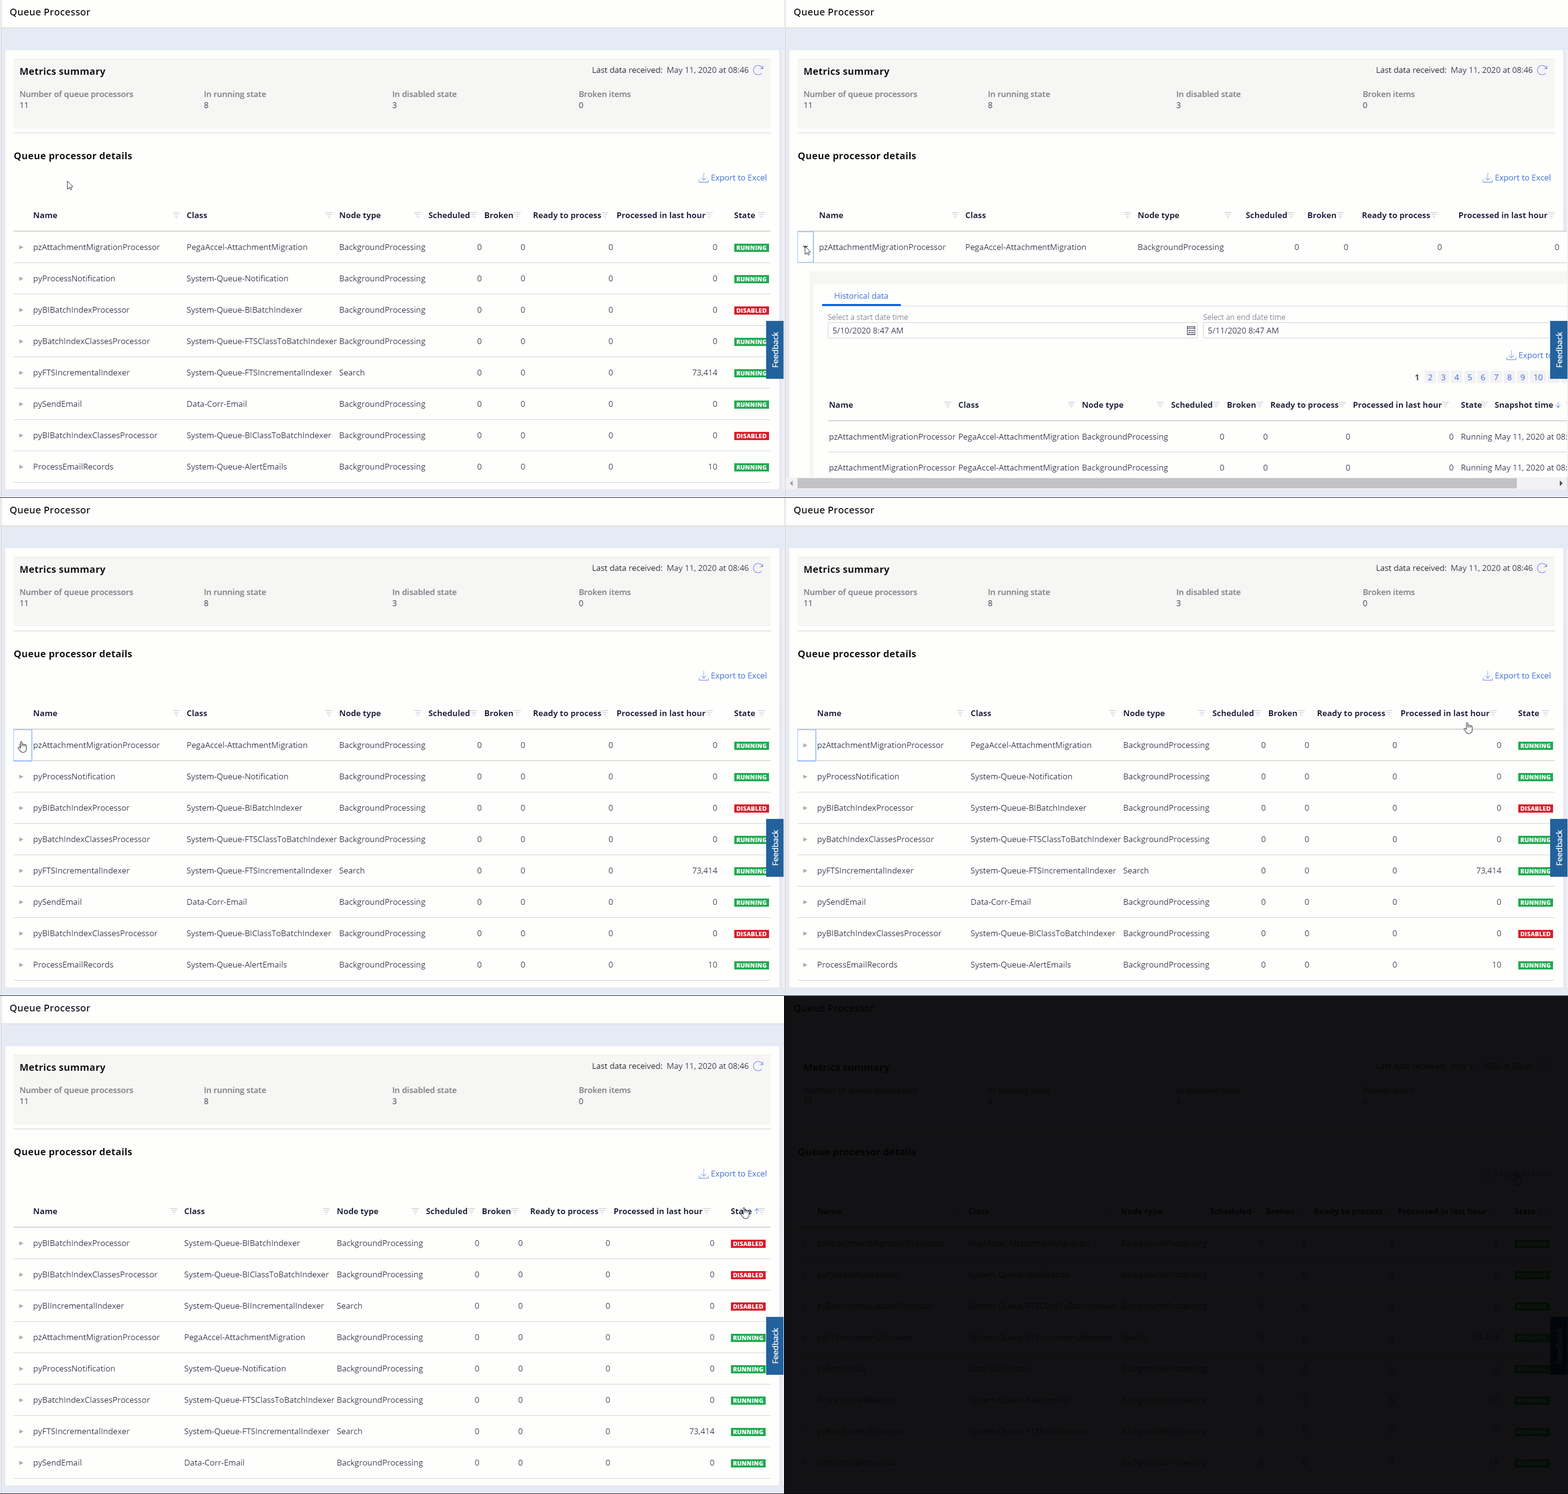
Exploring the Queue Processor landing page in PDC

Have a question? Get answers now.

Visit the Support Center to ask questions, engage in discussions, share ideas, and help others.

Did you find this content helpful?

Want to help us improve this content?

We'd prefer it if you saw us at our best.

Pega.com is not optimized for Internet Explorer. For the optimal experience, please use:

Close Deprecation Notice
Contact us