Fine-tuning reports in Pega 7
Pega 7 provides new features and improved controls so you can fine-tune your reports and their charts to convey your information effectively.
For a reporting overview, start with Charts and Reporting: what's new in Pega 7 and follow the links in that article.
Report Definitions
In Pega 7 you have additional options for defining and formatting Report Definitions:
- Reports on Rule- classes offer filtering options to perform the equivalent of rule resolution (without circumstancing). On the Query tab of a Report Definition saved into Rule- or a class derived from Rule-, the "Filter by Rule Resolution" option appears below the list of report filters:
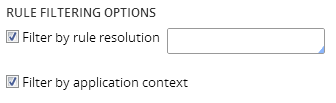
You can specify the defined on class in the field to the right of the option. If you do so, rule resolution works as it does in the engine. If you do not specify the defined on class, the filter operates in class-less mode and only takes RuleSet and availability into account when sub-selecting the results. - You can set fixed headers for reports in the Report Viewer. The option is on the Report Viewer tab.
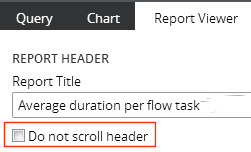
When you select this option, the column header row for this report stays in view as you browse through the data of the report. When you export the report as a PDF, the column header row appears at the top of each page in the PDF document. For summary reports, all group sections are expandable/collapsible. On the Report Viewer tab of the Report Definition you can check the "Expand all group sections in initial display" option to have all sections expanded when the report opens:
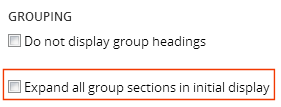
When viewing the report, you can expand or collapse all sections with a single click.In the same section on the Report Viewer tab you can eliminate separate group section header lines with subtotals, and display the report in a spreadsheet-style format:
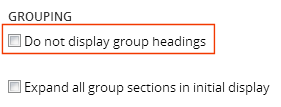
When you use this option, usual restrictions that the sort columns must match the Group By columns on the report are ignored, and you can sort the results based on any columns, and in any sort order, including sorting by aggregate columns.
Subreports
When reports make use of subreports, new capabilities increase the flexibility and usefulness of the subreports.
- Joins can now reference calculations, greatly extending the usability of subreports for adding data to a report that is aggregated by time period or in other ways.
On the Data Access tab of a Report Definition, add a subreport to the report.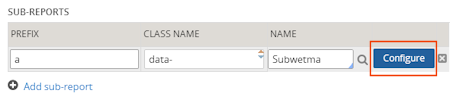
Click Configure to open the "Configure sub-report use" form: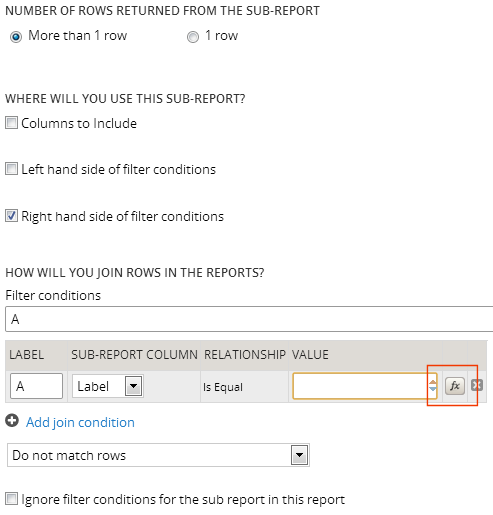
to make use of a calculation to create value of the right-side of the filter, click the icon indicated by the red box above. This opens the Calculation Builder, where you can select a calculation and populate it either with values or with references to parameters in the main report or the subreport. - You can now pass values for subreport parameters from the main report, making it possible to write fewer, more generic subreports. In the same configuration form shown above, you can enter a parameter such as "param.InputLabel" in the field to the right of "Is Equal" to provide the value for the filter.
For general information about subreports, see When and how to use sub-reports in Report Definition reports.
Charts
In addition to supporting a wide range of new chart types, the Pega 7 Chart Editor provides many new formatting options for charts. They include:
- Customizing color: In the Chart Editor, select "Color Settings" from the menu bar and select either option that appears to display a "Color Options" form. In the example below, a custom background color for the chart's coordinate grid is being defined:
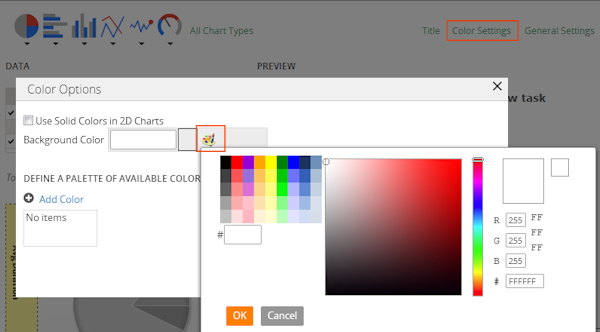
In addition, you can add a set of custom colors as a palette for the chart. Colors for chart elements such as pie slices, bars, and columns will be chosen from the palette of colors you specify.
The Color Picker shown lets you enter a color in three ways: in the left display, click on an Internet-safe color; in the center display select a general area of the spectrum in the narrow bar at the right, then drag the small circle to the precise color blend you want; or on the right, enter the RGB values or the six-character code for the color you want.
When using a custom color palette, if you do not enter enough colors for all of the chart elements to be displayed, the system selects additonal colors for you. - Conditional colors: You can assign colors to specific chart elements like pie slices, bars, and columns conditionally, based on either the Group By column value or the aggregate column value they represent. Under Color Settings, click Add Conditional Color to add a new color. Each conditional color consists of a condition and a color code. A color picker as described above helps you achieve exactly the colors you want
- Threshold colors: Similarly, you can assign colors to indicate thresholds, colored lines or regions displayed on the coordinate grid. This display can help the viewer see quickly what data has exceeded or fallen below thresholds you specify.
- You can display and export a chart by itself, without the report data.
- Additional chart-related features appear in the Landing page section, below.
For further information, see Working with charts in reports (Pega 7).
Landing page
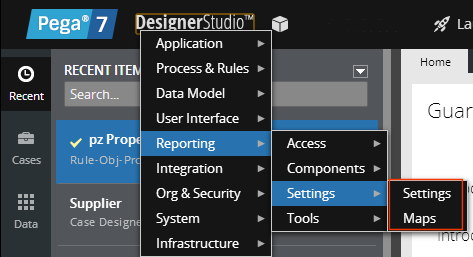
The Reporting > Settings landing page has been enhanced:
- You can specify that the settings on this landing page apply by default for all Report Definition charts in your applications:
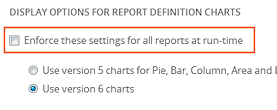
- You can choose to use the Flash charts available in PRPC versions 5, 6.1, and 6.2 for those chart types then available (pie, bar, column, line, area), or to use the newest versions of these charts available in versions 6.3 and 7.1.
- If you use the newer (version 6) charts, you can also choose to always use JavaScript for rendering instead of Flash, even if Flash is available on the end user's computer:
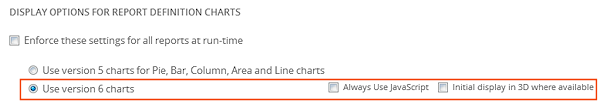
- For charts that support 3D mode, you can choose to initially display those charts in 3D by checking the checkbox at the area bound in red above.
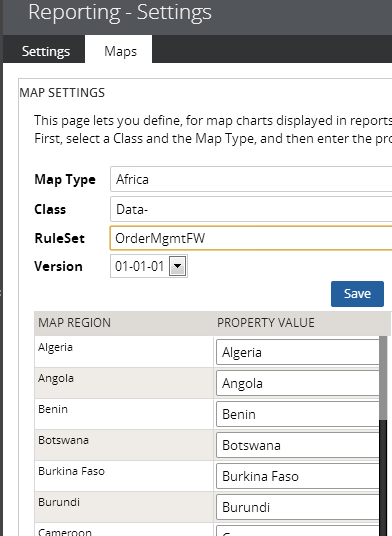
The landing page also has a new Maps settings tab where you can associate the property values in a particular class with areas or regions on any of the hundreds of maps PRPC provides to display the values in Report Definition reports:
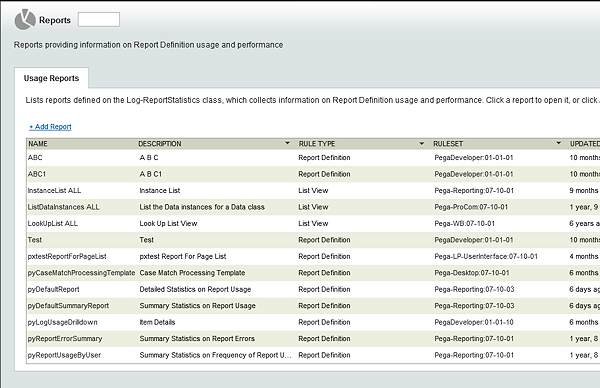
The Reporting > Tools > Usage feature gives access to reports that have information and statistics on report usage and performance by report and user. You can run these reports, customize them, and create your own custom reports: