Scenario planning results
The Scenario Planner landing page shows a number of useful KPIs, including audience simulations counts or projected reach, projected accepts based on adaptive models, projected value capture, as well as historical accepts, sends, and impressions.
Depending on the selected filters, the Scenario Planner view can display the results for a specific channel, action, group, or issue.Projected value capture
This tile shows the estimated value that the upcoming next-best-actions (outbound run
and inbound impressions) will bring with the currently selected configuration, as in
the following figure: 
Accepts (last 30 days)
This tile shows the number of accepted actions versus the aggregate number of
outbound sends and inbound impressions over the last 30 days, as in the following
figure:
You can change the time frame for historical data from the last 30 days to the last 60, 90, 180, or 365 days. You can also aggregate data from the last full quarter up to a full year.
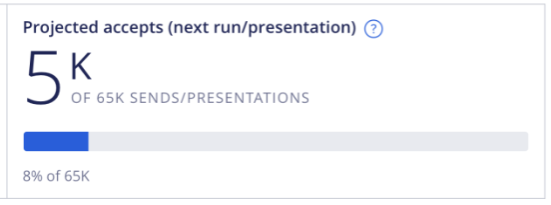
Projected accepts (next run/presentation)
This tile shows the aggregate number of sends or impressions with the projected
accepts that the upcoming next-best-actions (outbound run and inbound impressions)
will bring with the currently selected configuration, as in the following
figure:
Details table
The table shows the results per the selected simulation, issue, group, action, and channel. Use the filters on top of the Scenario Planner landing page to drill down to the details of a specific action or treatment, or see a broad scope comparison across the whole issue or group.
Previous topic Increasing your understanding of the effect of your business changes with the Scenario Planner Next topic Creating a data flow for testing Next-Best-Action strategy
