Operational KPIs
Operational insights can give the Next-Best-Action Operations team and stakeholders the confidence that actions are performing as expected, and the possibility to identify trends and anomalies that require attention. Moreover, the possibility of filtering and comparing current and past data ensures forwards- and backwards-looking transparency.
Changing the scope of data
Data can be presented for up to 15 months, depending on how you filter the data. The default filter options are:
- end date
- By default, the end date is your current date. If you access Action Performance Tracker through an alert, the end date indicates the moment when the change in performance occurred.
- timeframe
- For daily granularity, the tracker shows the data for the last two weeks. For monthly, it displays data for the last 13 months (ending on the current month), and for quarterly, the last 5 quarters (ending on the current quarter). The timeframe filter allows you to see how the actions are tracking against a chosen period, for example last year.
- scope
- Reflects the hierarchy of treatment, action, group, and issue. You can choose up to 10 of a selected scope at a time to compare.
- treatments, actions, groups, or issues
- Select items to populate the dashboard (up to 10 at the same time).
- channels
- You can choose from a list of channels that have actions and treatments associated to them, both inbound and outbound.
- advanced filters
- If your line of business requires more detailed hierarchy than the standard group and issue level, advanced filters allow you to filter by customer segment and subsegment.
Next-Best-Action lift
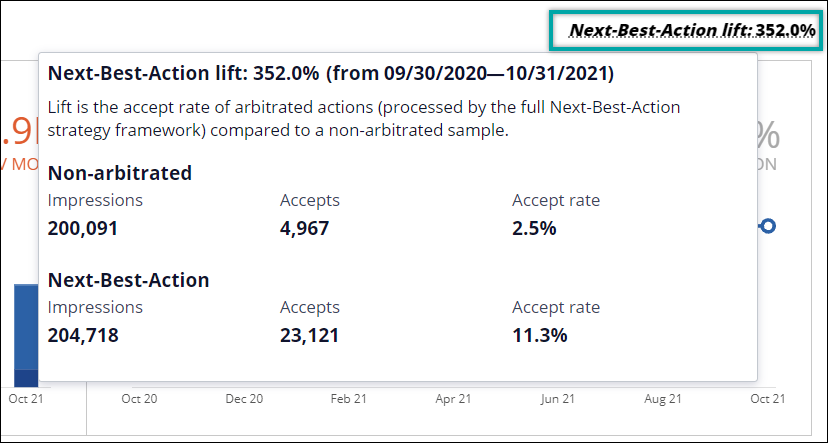
Next-Best-Action lift is the accept rate of arbitrated actions (processed by the full
Next-Best-Action strategy framework) compared to a non-arbitrated sample. You can
see the total lift for the current selected data in the upper-right corner of the
Action Performance Tracker landing page. To see how the KPIs compare between the
Next-Best-Action and the non-arbitrated sample, click on the lift to see the detail
overlay.
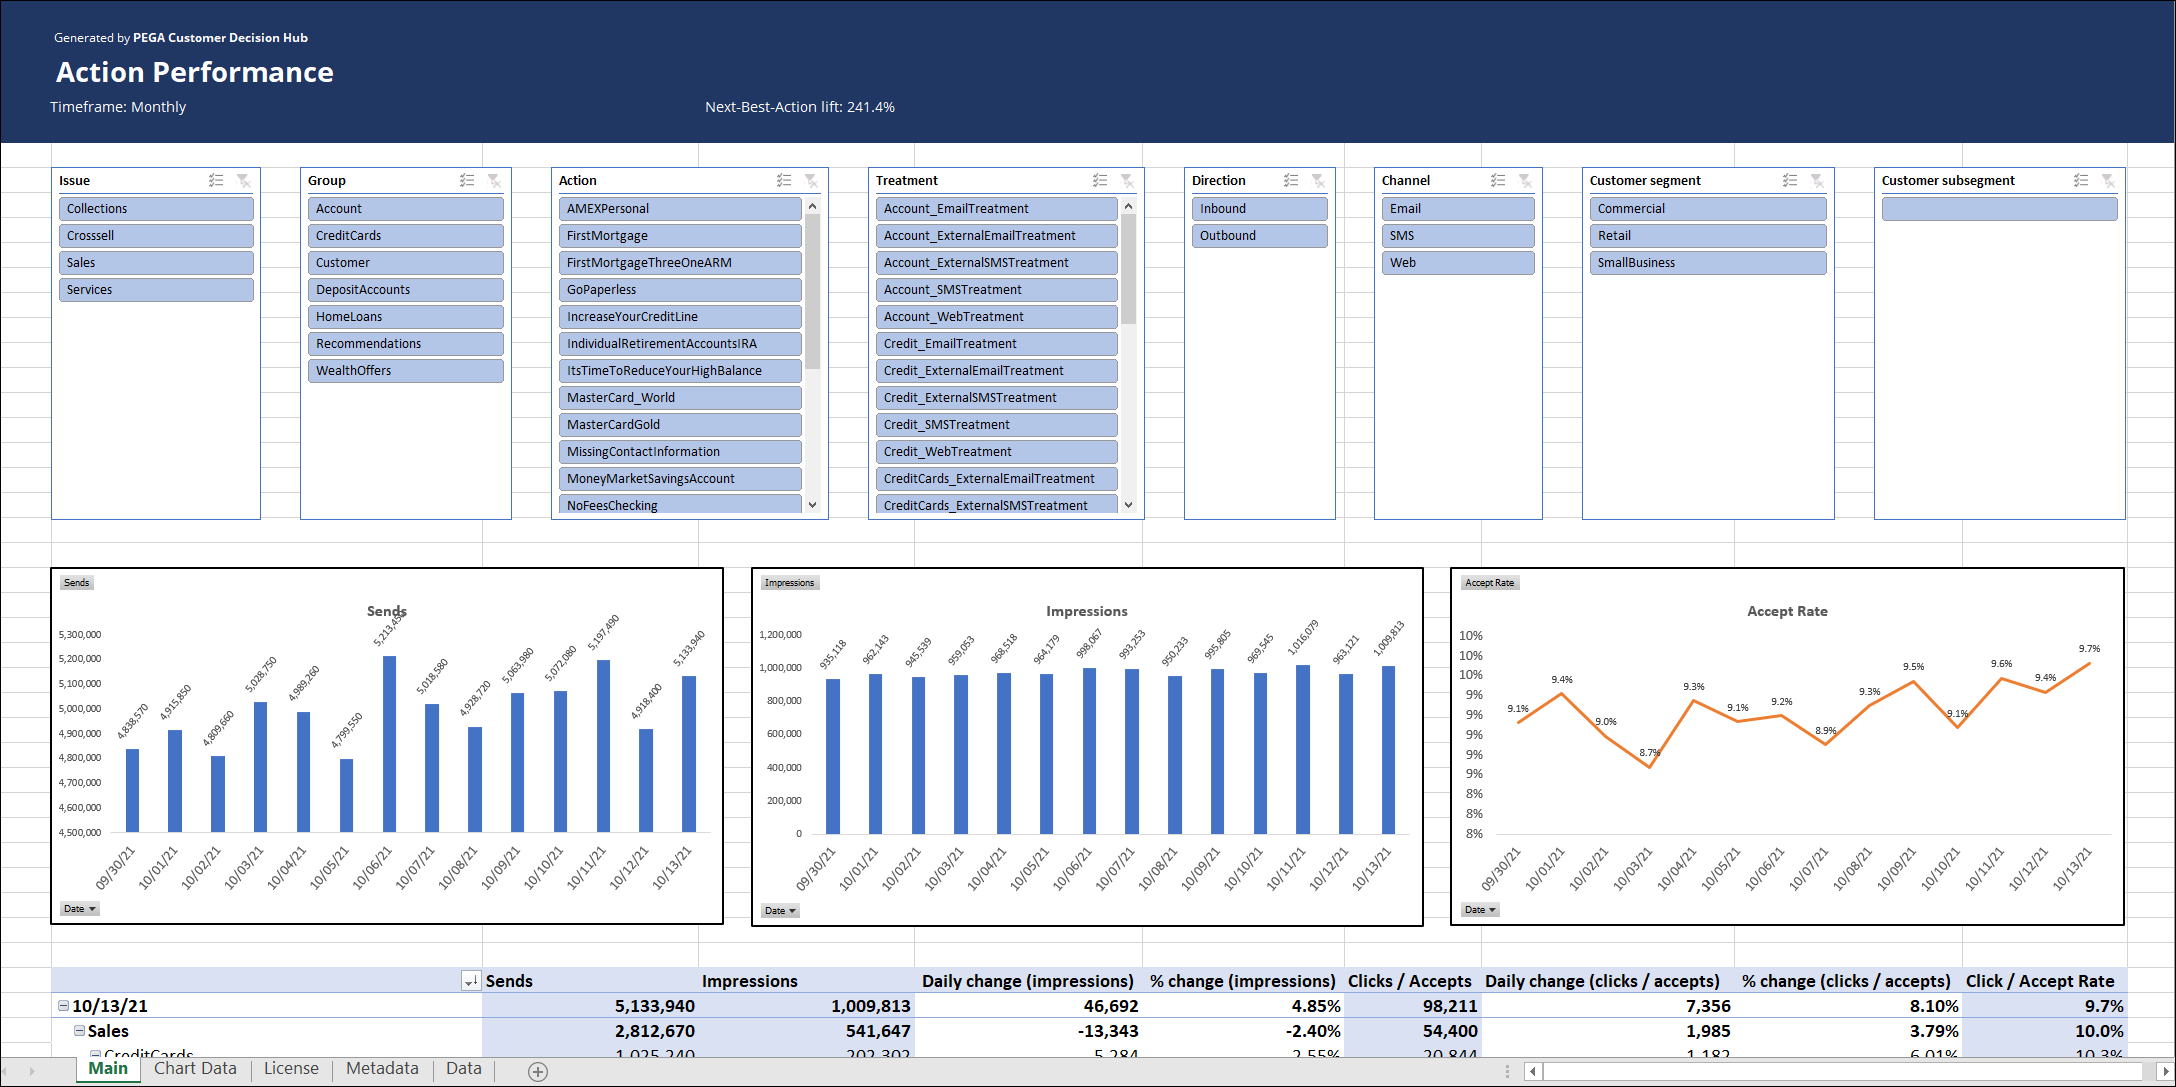
Data exports to a Microsoft Excel file
To automatically generate an offline Excel spreadsheet that contains the metrics for the selected timeframe, in the upper-right corner, click Export Excel file. The file will begin downloading automatically in a new browser window. The report retains Action Performance Tracker's filters, allowing you to inspect KPIs. Use the sheets at the bottom to see the source data.

Example scenario
You receive a notification about a significant change in customer activity, for example, an unusually low number of impressions. You click the alert, to go to the Action Performance Tracker landing page, which is already pre-populated with the data that triggered the alert. After consideration, you investigate the issue further by changing the scope, for example, from action to group, to check whether the anomaly pertains to a higher level. By comparing data across time, or across multiple actions, you can pinpoint the exact place and time of the change in performance. If there is a need to forward the details to the appropriate line of business, or for example, an IT department, you export an Excel report for offline analysis.
Previous topic Action Performance Next topic View Waiting Action Counts
