How to manage work in Pega Autonomic Event Services
As recurring patterns develop among key alerts and exceptions, Pega® Autonomic Event Services aggregates them and their associated data into work objects (action items or exception items). These appear in the Action Items work area in the Manager portal for use in workflows. This capability enables you to assign resources for information gathering, diagnosis, and remediation.
- About action and exception items
- Working with work items
- Finding work items
- Action item work forms
- About MU, BrowsInt, and DBAnom action items
- Exception item work form
- Using the Cluster Summary reports
Accessing the Action Items area
- On the welcome screen, enter your manager ID and password and click . Remember that passwords are case-sensitive.
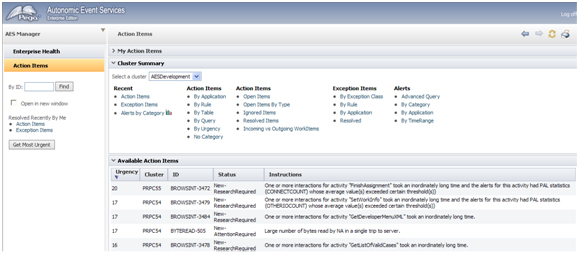
- Click the Action Items bar in the navigation panel to open the work area.
- Expand the Available Action Items section to display the work list as shown in this example:
About action and exception items
Pega Autonomic Event Services creates two types of work objects for use in the work flows: action items and exception items.
Action items — When a monitored system generates alerts, they are written to an Alert log and sent by SOAP to Pega Autonomic Event Services. The application parses the alerts and stores the records in its database. At specified intervals, alert agents gather the data and create or update work objects called action items.
Action items are typed by the underlying alert as described in the table below. The first time an alert is generated, the agent creates an action item, which is keyed by an ID and a prefix identifying the alert type. Each item is correlated to an event's underlying problem or query, which is defined in the Problem Correlation or Query sections on an action item's work form.
For example, a monitored node generates a PEGA0025 alert when it performs a list operation request that included properties that were not exposed columns in the queried table. Pega Autonomic Event Services also creates an action item called DBCOL-84. The underlying cause was a query that needed 3 properties ([pyPrimaryPageName pyRecordRuleName pyRecordClassName ] table [pr4_rule] database [PegaRULES].
The action item is updated as additional events arise from the same underlying problem correlation or query — a new action item is not created. See the section Action item work forms in this article for more information.
Initially the urgency of the action item is 0. You use the urgency value to monitor the growing seriousness of an item. The value increases as new correlated events occur. Factors affecting the magnitude of the increase include the type of work item, the frequency and number of occurrences, the number of days since the last occurrence, and the degree to which the alert KPI values exceed the threshold values.
A new action triggers an email notification to NewActionWork subscribers as defined in the Manage Subscriptions section in the Administration area.
For a list of alerts and links to detailed descriptions of each, see Performance alerts, security alerts and AES.
Exception items —These are processed similarly to alerts. When a PRPC server generates exceptions, they are sent by SOAP to Pega Autonomic Event Services. The application parses the exceptions and stores the records in its database. The first time an exception occurs, the agent creates an exception item. The item is keyed by an ID and the prefix Exception. Each item is correlated to the system event that caused it. The agent updates an item if the exception reoccurs.
The table below describes action and exception items:
ID Prefix | Alert Message ID | Description |
|---|---|---|
BrowsInt | The elapsed time for an HTTP interaction time exceeds the threshold setting (expressed as milliseconds). | |
DBCommit | The elapsed time for a database commit operation exceeds the threshold setting (expressed as milliseconds). | |
DBRollback | The elapsed time for a database rollback operation exceeds the threshold setting (expressed as milliseconds). | |
ByteRead | A query to the PegaRULES database loads into memory a quantity of data (bytes) that exceeds a per-interaction threshold (expressed as megabytes). | |
DB DBAnom | PEGA0005 | The elapsed time for a query to the PegaRULES database exceeds a threshold setting (expressed as milliseconds). A DBAnom item represents a group of PEGA0005 alerts triggerd by system performance issues rather than sub-optimal queries. |
PRPCFailedStart | The PegaRULES engine attempted to start, but failed. | |
AgentDisabled | Processing errors cause the system to disable an agent. Note: An action item is created only if the node has a production level greater than 2 (development). The alert will be reported to AES. | |
Service | Total service request time exceeds a the threshold (expressed as milliseconds). This is time from when the Process Commander server receives a service request from an external system until the response is sent back to the external system or client. | |
LongReq | A requestor has been servicing one interaction for a a long elapsed interval (expressed as seconds) | |
Connect | A response was received from an external system or database after a connector request was sent to that system, but the interaction time exceeds a threshold value (expressed as milliseconds) | |
DBCcol | The system determines while performing a list operation in the PegaRULES database that a request includes one or more properties that are not exposed columns in the queried table (expressed as number of columns). | |
DBConnection | The time to acquire either an initial or an existing database connection has exceeded an elapsed time threshold (expressed as milliseconds). | |
DBRows | A list operation on the PegaRULES database list returned a number of rows larger than a threshold count limit (expressed as number of rows). | |
MU | JVM has used garbage collection (GC) to reclaim memory from one of the memory pools, but failed to reduce the used memory below a specified threshold (expressed as a percentage of the memory pool size). | |
HTMLStream | The size in bytes of any HTML stream sent to a browser exceeds a threshold value (expressed as bytes). | |
PageListSize | During the creation of a Page List property, there are more elements then a specified threshold (expressed as number of elements). A large number of embedded pages may consume substantial memory and may indicate a report design issue or a looping logic issue. | |
Exception | Not Applicable | Exceptions messages indicating abnormal processing behavior. |
Working with Pega Autonomic Event Services work items
When an action or exception item is created for any node across the enterprise, it is automatically added to the Available Action Items section (a browser refresh is not required). The Cluster column indicates which cluster the item is associated with.
New action items are given one of these statuses depending upon an evaluation by Pega Autonomic Event Services:
- New-AttentionRequired — The issue and its causes are clearly understood. The item's work form contains suggestions that a system engineer can use to remediate it.
New-ResearchRequired — The item is probably due to issues for which there is no easily defined cause or well-defined solution. These items might require a system engineer to investigate, diagnose, and create the appropriate remediation. To assist the process, the system engineer should use the data that Pega Autonomic Event Services has gathered.
New exception items have a status of New (appears in a blue background).
Hover over individual items to display summary details as shown here:

Assigning new items
To assign an item:
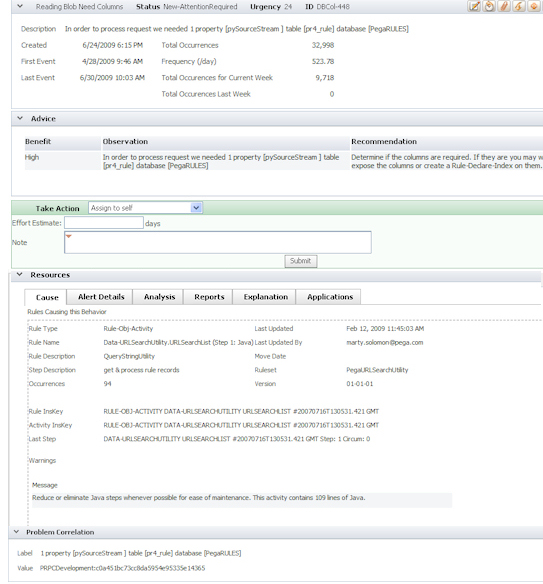
- Click the item on the list to open its work form. Here is an example of a DBCol action item work form with a status of New-AttentionRequired.
The Take Action section for an action item displays these actions and local actions in the drop-down list.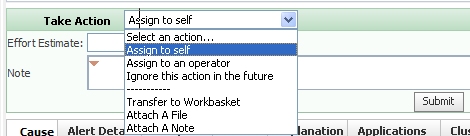
- Assign the item or perform a local action.
- Select Ignore this action in the future if you want to resolve the item and not reopen it if the same action item re-occurs (as defined by the values in the Problem Correlation or Query sections).
Finding work items
The navigation panel contains search controls as shown here:

To open the item with the highest urgency value, click . The work form opens and a link to it appears below the button.
To find a specific action or exception item:
- Enter the item identifier (including the prefix). In the above example, the search is for action item DB-14. You cannot search for multiple items based on a partial identifier such as DB-.
- Optionally, select the Open in a new window check box to display the item's work form in a new browser.
- Click . The item work form opens and a link to it appears beneath the button.
The Resolved Recently By Me section displays links to open those action and exception items.
Action item work forms
Click on a work item ID to open its work form, which is either an action form or an exception form. Action item forms share many components. However, there are variations based on the type of item. Here are the form sections:
- Action item summary section (all)
- Advice section(all)
- Query section (DB item types only)
- Take Action section (all)
- A set of tabs used to display action item details (all)
- Problem Correlation section (all except DB item types)
Action item summary section
Here is an example of this section for a DB action item form.
The following describes the information (variations are noted):
- Description — Either the Recommendation text or the Observation text displayed in the Advice section (depending upon the action item type). The top row (most serious) advice text is used if there are multiple advisories. The description contains the problem correlation or query associated with the item.
- Created — The date and time when the action item was created.
- First Event — The date and time the first (oldest) alert in the action item.
- Last Event — The date and time of the last (most current) alert in the action item.
- Total Occurrences — The total number of alert occurrences comprising the action item.
- Frequency (/day) — The number of days between the first and last events divided by the number of total occurrences. For example, if the number of total occurrences is 138 and the number of days is 44, then the frequency is .32 alerts per day
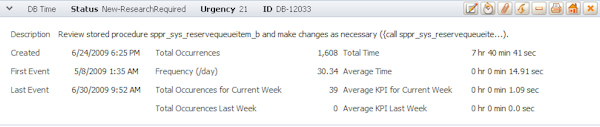
- Total Time — The total elapsed time all the rules related to the alert occurrences took to process (in hours, minutes, and seconds). The rules are listed on the Causes tab at the bottom of the work form
- Average Time — The total time divided by the total number of occurrences.
- Average KPI for Current Week (and for Last Week) — The total KPI values for alerts occurring in the stated time period divided by the number of alerts.
Advice section
This information includes a table showing one or more parts of the query statement or activity step that is problematic and should be fixed. Here is an example of this section for a DB item:
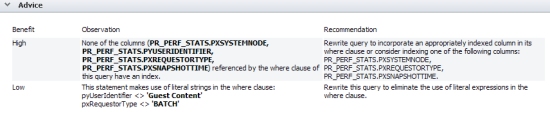
The table contains these columns:
- Benefit — Ranks the benefit to system performance that will be derived by fixing the problem. The rankings (High, Medium, or Low) are based upon statistics derived from the alert information.
- Observation — The information is dependent upon the type of item. For instance, a DB item specifies the text within a query statement that is faulty; a DBCol item specifies the last step in the activity that caused the alert.
- Recommendation — Provides a suggestion on how to fix the query.
Query section (DB items only)
Here is an example of the section:
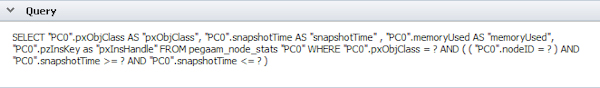
The information includes the full, non-truncated query that contains the errors that caused the alerts when the rules listed in the Cause tab (located at the bottom of the form) executed the rules. The alerts in a given DB action item share this query.
Take Action section
Contains a pull-down list of the actions and local actions available. Also contains fields for notes and for an effort estimate.
A row of tabs at the bottom of the form enables you to drill down into a variety of system, transaction, and performance metrics.
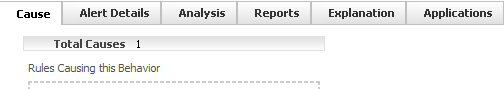
- Cause tab — Shows the rule or rules that triggered the action item alerts.
- Alert Details tab — Contains a list report of the alerts comprising the action item.

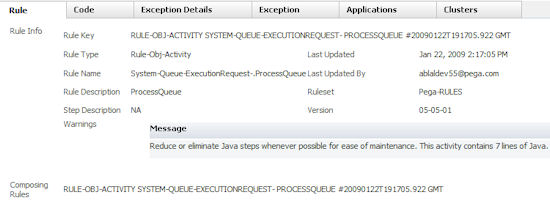
- Click on an alert in the list to display a report about the alert, as shown in the example below.
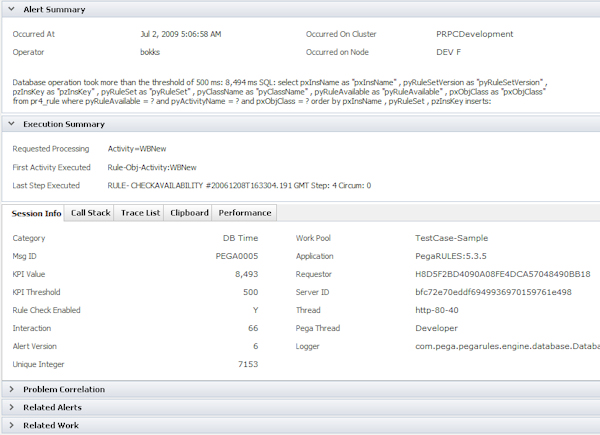
- The alert report contains the following sections:
- Alert Summary — Provides a text description of the alert that occurred including the threshold value and actual value. Also shown is the query that triggered the alert when it was executed.
- Execution Summary — Displays the activity that was executed when the alert was triggered. This section contains a set of tabs that enable you to retrieve reports about the execution of the activities that triggered the alert: These include call stack, trace list, and so on. Many of the items in these tabs have drill-down capability for further analysis.
- Problem Correlation — The event that triggered the alert (the event depends upon the type of item), the name of the cluster, the alert category, and a problem correlation hash code representing a number of process conditions that existed when the alert occurred.
- Related Alerts — Displays a list of other alerts for this requestor that occurred during the same interaction with the server.
- Related Work — Contains a link that you click to display a review form of the action item that the alert is contributing to.
- Analysis tab — Contains a chart and a list report that provide statistical analysis of Key Performance Indicator (KPI) values generated by all of the alerts comprising the item. Looking at the data collectively is useful for discovering overall patterns that may suggest one or multiple underlying causes for the alerts and the relative seriousness of the alerts as a whole.
You can identify an individual alert's KPI value in the alert report's Alert Summary section. In the example below, a PEGA0005 alert shows a KPI value of 762 milliseconds, which exceeds the 500 ms threshold by 262 ms.

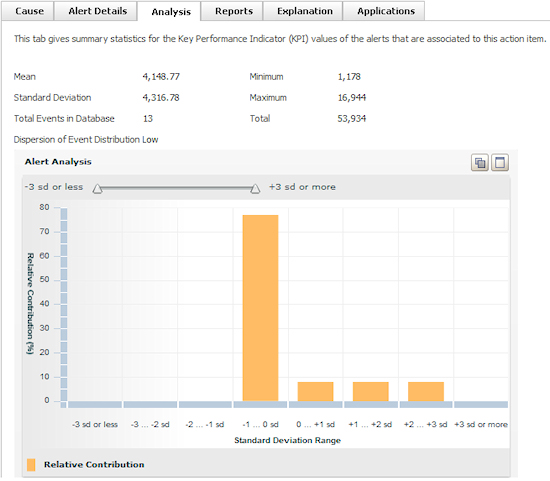
The histogram identifies the distribution of all KPI values comprising the action item. Individual KPI values are grouped within bins, each of which is defined as a standard deviation (range). There are eight standard deviations in the chart.
Below is an example of a chart for a DB action item. The mean KPI value is 611 milliseconds (total KPI divided by total count of alerts) or 111 milliseconds beyond the 500 ms threshold value.
Overall, the results suggest that most of the underlying events are within one standard deviation (calculated to be 133 ms). The difference between the mean and the threshold values indicates the relative seriousness and predictability of the alerts. The greater the difference, the more serious the impact. Note that the statistics may periodically change as new alert data is gathered and updated by the agent.
In the chart header, the Dispersion of Event Distribution value categorizes alert events in one of three dispersion categories, which are based upon the percentage of total events that fall within each standard deviation.
Low — More than 92.5 % of the events are within +/-2 sd’s of the mean
Medium — More than 82.5% of the events are within +/-2 sd’s of the mean
High — Fewer than 82.5% of the events are within +/- 2 sd’s of the mean
As seen in the statistics table beneath the chart, the dispersion in the above example is medium, because 92% of the total events were within +/- two standard deviations.
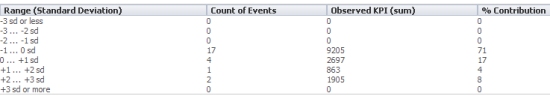
To investigate the underlying alerts within a distribution range, click on a row in the table. Click on the -1...0 sd row to open a list view of the alerts within the range. No more than ten most current alerts are displayed, regardless of how many alerts occurred.
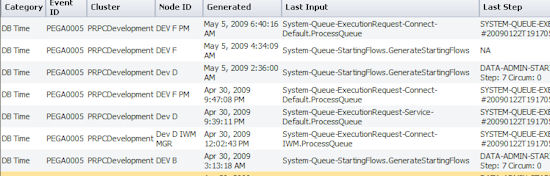
In the above example, there are a variety of inputs at various times, suggesting multiple underlying causes. Click on an individual item to display the alert report and retrieve more details such as the alert summary, the execution summary, and so on.
- Reports tab — Contains graphical reports showing alert activity pertaining to the item, including the Alert Count by Day, KPI Total by Day, and Alert Count by Node reports.
- Explanation tab — Contains the following list:
- Observation — The same text as in the Observations column in the Advice section.
- Explanation — General technical background information about the problem. Use this information in combination with the Recommendation field in the Advice section to formulate a solution.
- Applications tab — Contains a list of the applications being executed when the issue occurred and the number of occurrences in each.
Urgency Explanation section
Contains a report listing the factors that are used to evaluate the item's urgency and their individual contribution to the total. The columns are:
- Contribution— The incremental urgency adjustment for a given factor.
- Running Total — The running total of the contributions of the various factors.
- Description —A description of the factor affecting the work object urgency.
Problem Correlation section
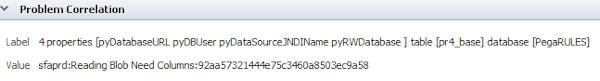
All of the alerts comprising an action item are identified by the contents of this section. It contains two fields:
- Label — The event that triggered the alert. The event depends upon the type of item. For instance, a service item correlation is the last step in an activity; for a ByteRead, the correlation is a specific activity (typically a Rule-Obj-Activity rule type).
- Value — A combination of the name of the cluster, the alert category, and a problem correlation hash code representing a number of process conditions that existed when the alert occurred.
Here is an example of the Problem Correlation section for a DBCol action item, which indicates the columns that need to be exposed for a given table and database:
About MU, BrowsInt, and DBAnom action items
This section describes action items that include statistics and recommendations based upon correlated alerts or PAL statistics. The diagnostics help discover multiple or complex underlying issues.
MU action items
The memory utilization (MU) action item is triggered by a PEGA0028 alert on any monitored node. The problem correlation is the name of the node and a timestamp of the first occurrence. All alerts of this type occurring within two minutes of each other (on the same node) are considered to be correlated and grouped with the action item.
In addition, Pega Autonomic Event Services monitors PEGA0001, PEGA0004, PEGA0005, and PEGA0027 alerts, which are likely related to a PEGA0028 alert. This data helps you pinpoint multiple factors contributing to a specific condition. Note that a MU item may have no related alerts.
These and the PEGA0028 alerts are listed in the Alert Details tab. Here is an example of an item comprising two PEGA0028 alerts, which have four PEGA0001, two PEGA0005, and five PEGA0027 related alerts:
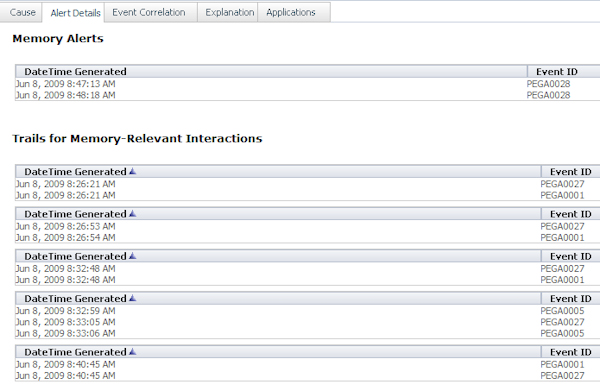
On the Event Correlation tab, a time-series plot shows the temporal relationships among the alerts.
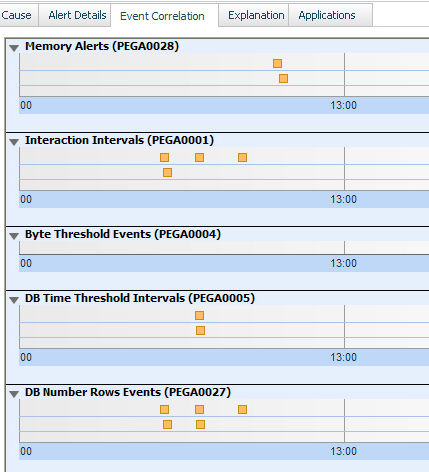
Each alert is indicated by a square, which you can click to open the alert message. You can expand or contract the time frame (one-hour scale) by using the slider bar at the bottom of the chart. To completely expand the chart, click .
BrowsInt action items
A browser interaction time (BrowsInt) action item is created whenever a PEGA0001 alert is received. The problem correlation is the first activity that caused the alert. In addition, Pega Autonomic Event Services monitors PAL statistics that are related to each activity invocation. Advice is given whenever the average of one or more of the following statistics (over all PEGA0001 alerts for the same start activity) exceeds a specified threshold as follows:
- Commit count — 5
- Connect count — 5
- Index count — 20
- IO count — 400
- Trace list index — 800
- Alert count — 1.5
When Pega Autonomic Event Services receives an additional PEGA0001 alert arising from the same starting activity, it recalculates the averages of the PAL statistics and compares them to the respective thresholds. If the threshold for a given statistic is exceeded, then the advice for that statistic is attached to the action item.
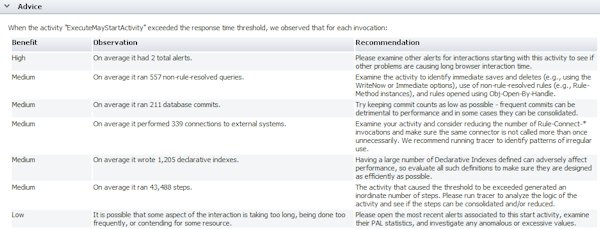
The Observation column in the Advice section provides the actual values for each of the related PAL thresholds that were exceeded. In the example below, there was an average of 211 database commits per interaction, far exceeding the threshold value of 5. Consult the Recommendation column for advice on how to mitigate the issue.
DBAnom action items
PEGA0005 alerts triggered by declining system performance (rather than sub-optimal queries) are considered anomalous. Issues contributing to these anomalies include JVM configuration, database sizing, or backup processes.
Once a week, DBAnom action items are created as follows:
- Pega Autonomic Event Services identifies PEGA0005 alerts if their KPI values far exceed the average value for all alerts during the week.
- If two or more of these alerts occur within two minutes of each other, Pega Autonomic Event Services groups them.
- If two or more groups occur within at least thirty minutes of each other, the application considers them the result of an anomalous event and creates a DBAnom action item.
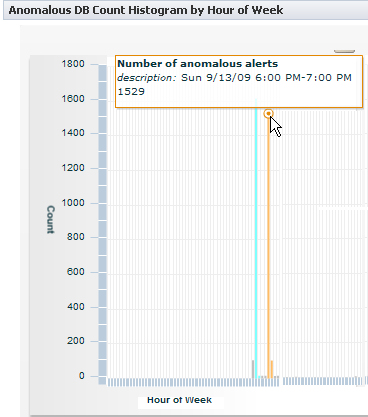
The DBAnom item contains a set of interactive charts in the Analysis tab summarizing PEGA0005 alerts for the week. The alerts are graphed as vertical bars. Hover your mouse over them to display the statistics.
The charts are as follows:
- Anomalous DB Count Histogram by Hour of Week — Count by hour of all alerts in the last week.
- Anomalous DB KPI Histogram by Hour of Week — Cumulative time (in milliseconds) by hour of all alerts in the last week.
These graphs use three colors to identify alerts that comprise a DBAnom item:- Gray bars identify alerts that do not belong to a DBAnom item.
- Blue bars identify the anomalous alerts comprising other DBAnom items created during the week.
- Orange bars identify the anomalous alerts that created this item.
- Focused DB Count Histogram for Long-Duration Anomaly by Minute — Alert counts by minute of all alerts contained in this DBAnom item.
- Focused DB KPI Histogram for Long-Duration Anomaly by Minute — Cumulative time (in milliseconds) by minute of all alerts contained in this DBAnom item.
- Anomalous DB Count Histogram by Day of Week — Cumulative alert count by day of all alerts in the last week.
- Anomalous DB KPI Histogram by Day of Week — Cumulative time (in milliseconds) by day of all alerts in the last week.
- Anomalous DB Count Histogram by Hour of Day — Total number of alerts by the hour of day, summed over all days of the week, of all alerts in the last week. This and the Anomalous DB KPI Histogram by Hour of Day (below) can help detect patterns such as spikes occurring between 2 and 3 PM every day.
- Anomalous DB KPI Histogram by Hour of Day — Cumulative time (in milliseconds) by the hour of day, summed over all days of the week, of all alerts in the last week.
- Anomalous DB Count Histogram by Minute of Hour —Total number alerts by the minute of hour, summed over all hours of the week, of all alerts in the last week. This and the Anomalous DB KPI Histogram by Minute of Hour (below) can help detect patterns such as spikes occurring 15 minutes after the hour, every hour.
- Anomalous DB KPI Histogram by Minute of Hour — Cumulative time (in milliseconds) by the minute of hour, summed over all hours of the week, of all alerts in the last week.
Exception item work form
The exception item work form contains these main components:
- Work Object section
- Take Action section
- Exception tabs
Work Object section
Here is an example of the section:

The section contains the following:
- Description — The error message text thrown by the root cause of the exception. The text is truncated to 64 characters.
- Exception event dates and counts — See the topic Action Item section above for information.
- Exception Class — The type the exception. For example, java.lang.NullPointerException
Take Action section
Use to assign, resolve, transfer, add attachments, and so on, to the exception item.
Exception tabs
The following set of tabs contains data about the exception:
- Rule — If the exception was caused by a problem with a rule, this tab contains information about that rule.
- Clusters — Contains the name of the cluster in which the exception was generated, and the total number of occurrences.
- Applications — The names of the applications running when the exception occurred and the exception count in application.
- Exception — Contains the stack trace and messages for the root cause and top-level exceptions.
- Exception Details — Contains a list report of the 10 most recent occurrences of the exception. Click on an item in the list to open the exception report.
- Code — Contains information if the exception was thrown from a rule.
Using the Cluster Summary reports
This section provides sets of graphs and reports pertaining to alert and exception item activity.
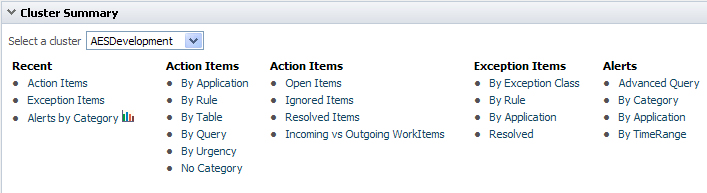
Before you use the options, select a cluster in the drop-down list at the top of the section. The options are categorized into groups as follows:
- Recent — Provides reports of action and exception items created in the past ten minutes.
- The Action Items report shows a summary of action items for the selected cluster that have been updated in the past ten minutes.
- The Exception Items report shows a summary of the exception items for the selected cluster that have been updated in the past ten minutes.
- The Alerts by Category report shows the alerts received by Pega Autonomic Event Services for the selected cluster over the last ten minutes.
- Action Items (two columns) — Under the first column, you can view a list of action items organized by application, rule, table, query, urgency, or by things that do not fall into one of the known categories. Options in the second column let you view a list of items by their resolution status.
- Incoming vs Outgoing Work Items — Select this report to display a summary of new or open action items for a date range that you specify.
Creating a report
Click the report name, enter the start and end dates, and click .
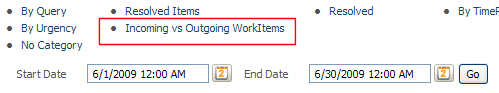
The report displays as shown in the following example:
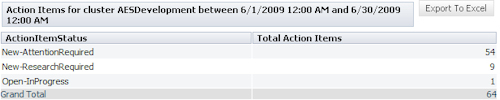
Click a row to open a list of items in each status category.
- Alerts by Category — This report allows you to view all of the alerts for the selected cluster categorized by alert type.
- Exception Items — These reports allow you to view the exception items organized by the exception class, by the rule that caused the exception, or by application.