
Report Viewer provides simplified user experience
Valid from Pega Version 7.1.7
In the Report Viewer, improvements simplify the user experience when working with reports. Column headers display initial sort order and type, and you can hover over a column header to display and use its context menu, which includes options for ad-hoc sorting and filtering. Developers can specify various pagination modes and set an option to keep the header in view while users scroll through the report.
For more information, see Report Viewer.
Enhanced BIX file naming
Valid from Pega Version 7.1.7
To help clarify file names, BIX extract output files and manifest files can now contain parameters. Parameters can include the rule name, the extract's run time and date, and a unique run sequence number. Special characters such as spaces, hyphens, or number signs (#) in the output or manifest file name are converted to underscores. In addition, the pxExtractIdentifier and pxExtractDateTime columns have been added to the .csv output file.
For more information, see Extracting data with BIX and Extract rules - completing the File Specification tab.
List view and summary view reports might not display in HTML5-compliant browsers
Valid from Pega Version 7.1.7
List view and summary view reports use framesets to provide a view of drill-down reports. HTML5 does not support framesets, so these reports might not display well, or at all, in versions of browsers that are compliant with HTML5.
To prevent display issues, re-create the custom list view and summary view reports that you need as report definition reports. Standard management reports are already available as report definition reports.
As of Pega 7.2, list view and summary view rules are deprecated. For more information, see Discontinued support for list view and summary view rules.
Enhanced chart control improves displaying data as a chart
Valid from Pega Version 7.1.7
The renewed chart control has an improved properties panel and provides HTML5-compliant pie, column, bar, area, line, and gauge charts. The chart source can be a report definition, a clipboard page, or a data page. You can customize basic and threshold colors, borders, line widths, labels, and other chart elements. A preview on the property panel instantly displays the effects on the chart of property changes you make.
For more information, see Harness and section forms - Adding a chart.
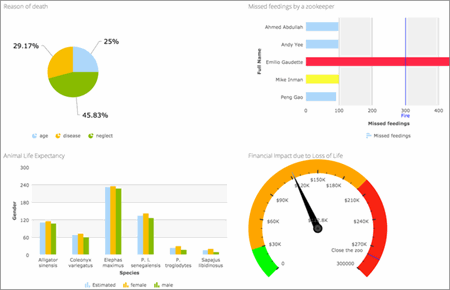
HTML5-compliant chart types
Case-insensitive filtering in reports
Valid from Pega Version 8.2
Filtering in reports is now case-insensitive, improving the reporting and searching experience. You can turn off case-insensitive filtering, for example, by using an activity. You might want to do this if your index is too big or if the length of time it takes for indexing impacts performance.
For more information on report filtering, see Editing filter conditions.
More display options for charts
Valid from Pega Version 8.2
Display properties have been expanded for charts that you add to a report harness or section. In addition to setting general display properties, you can set visibility and color options, control hover highlight behavior for data points and legends, and define more presentation options for grids and tooltips. The additional presentation options enhance your chart design and provide a way for you to effectively highlight important data.
For more information about configuring charts, see Harness and section forms - Adding a chart.
Better navigation between pages
Valid from Pega Version 8.2
The navigation between landing pages and configuration pages in App Studio has changed so that only one tab at a time is displayed in the work area. This change eliminates the maximum tab limit message. Navigate to previous pages by clicking the back arrow at the top of the work area or click the button in the workspace header to open a page in the selected device preview.
Progress gauge and double donut charts
Valid from Pega Version 8.2
To better visualize data, use the new progress gauge chart and double donut pie charts. The progress gauge chart measures the progress made against a goal. The double donut pie chart shows two layers of data in a single chart. The progress gauge chart can be included in reports and dashboard widgets. The double donut chart can be added to dashboard widgets.
For more information about including charts in reports, see Harness and section forms - Adding a chart.
For more information about adding charts to dashboard widgets, see Adding a widget to your dashboard.