
 Area
chart
Area
chart
Area
chart
Area
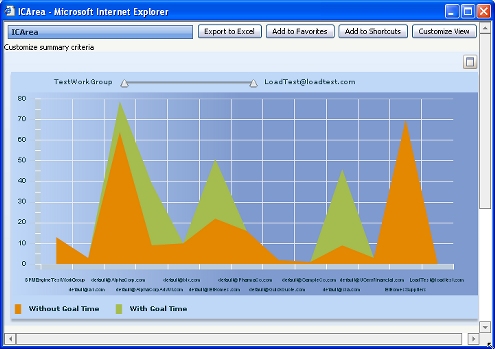
chartAn area chart presents data points with filled space rather than points, curves or lines.
For example, the following area chart plots counts by organization unit of open work objects that have a goal time, and also plots open work objects that lack a goal time.
To create an interactive area chart:
Interactive as the Chart Output
Type.Area type.
|
interactive chart, slider |

|
About Summary
View rules
About Report Definition rules |
 Definitions —
A
Definitions —
A