What's new in system administration 8.7
New features for system administration provide your system operation staff with more options for managing your system and data in Pega Platform. Enhancements for configuration settings, logging, queue processing, searching and reporting, and more, increase your administrative power and save administration time.
Centralized and searchable System Settings Guide
Pega Platform provides the System Settings Guide, a centralized and searchable guide that contains descriptions of the configuration settings in the system.
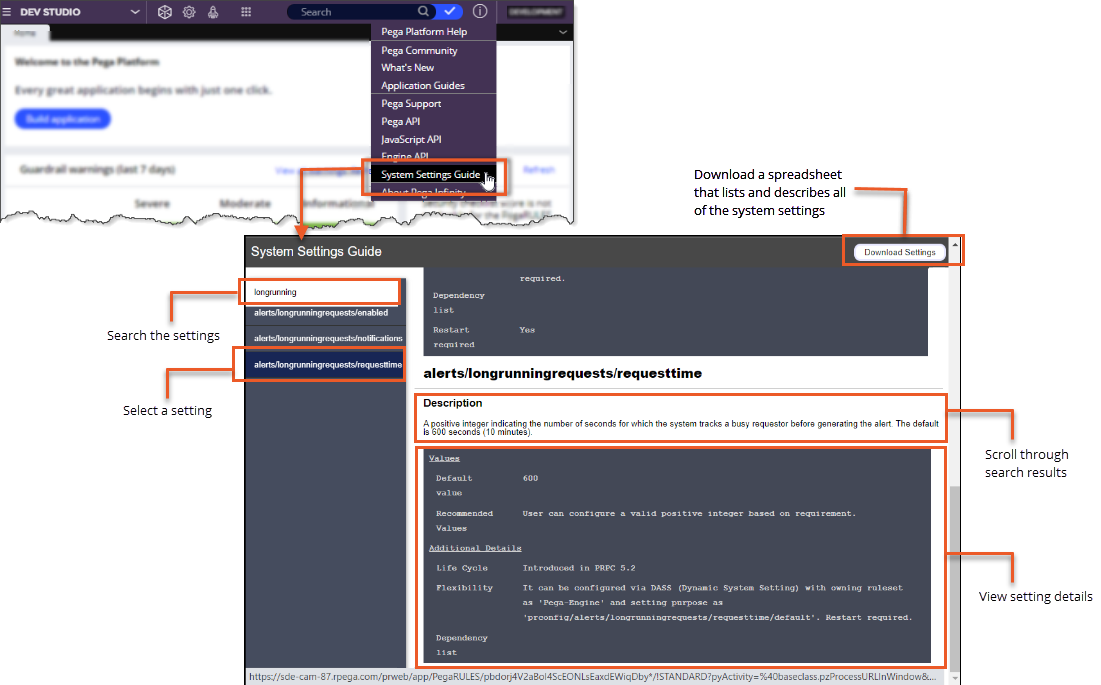
The guide provides developers and system administrators with more insight into the configuration settings that control the system, which enables them to make decisions about adjusting settings to improve system performance.For example, as a system administrator, you review the Pega log file and find an instance of the PEGA0019 alert, which indicates that a requestor has been servicing one interaction for a long time. To learn more about the setting, you open the System Settings Guide, enter longrunning in the Search field, and then select the alerts/longrunningrequests/requesttime setting from the search results, as shown in the following image.
In the setting details, you see that the default value for the setting is 600 seconds (10 minutes). To allow slightly more flexibility in requestor servicing time, you decide to increase the setting value to 720 seconds.

For more information, see Viewing system configuration settings.
Expanded logging capabilities
New features streamline the creation of custom log categories and expand the options for modifying log levels.
You can now:- Search log categories for specific loggers and create custom log categories in Admin Studio.
- Modify log levels for custom log categories in Admin Studio. Additionally, you can define a reset period for the modified log levels and select additional criteria by which to filter log entries.
Searching and creating log categories in Admin Studio
| Feature | Description |
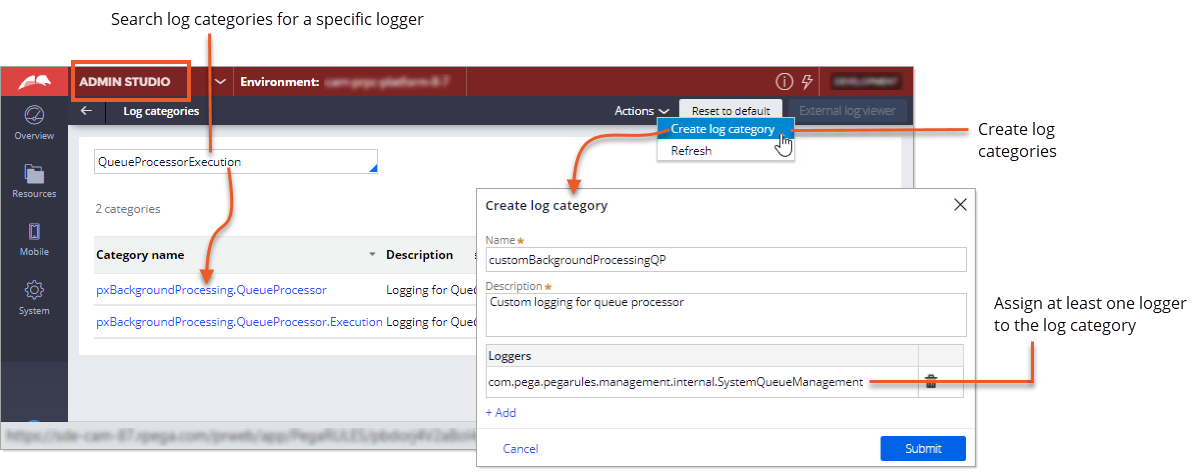
| Search log categories | On the Log categories page in Admin Studio, you can now search log categories for specific loggers. Searching log categories for specific loggers makes it simpler to manage loggers and helps to prevent duplicate log entries for a logger. |
| Create log categories in Admin Studio | You can now create custom log categories in Admin Studio. This change significantly streamlines the log category setup process by eliminating the need to switch from Dev Studio to Admin Studio to create and configure a log category. The following changes apply when creating log categories in Admin Studio:
|
The following figure shows searching and creating log categories in Admin Studio

Modifying log levels in Admin Studio
| Feature | Description |
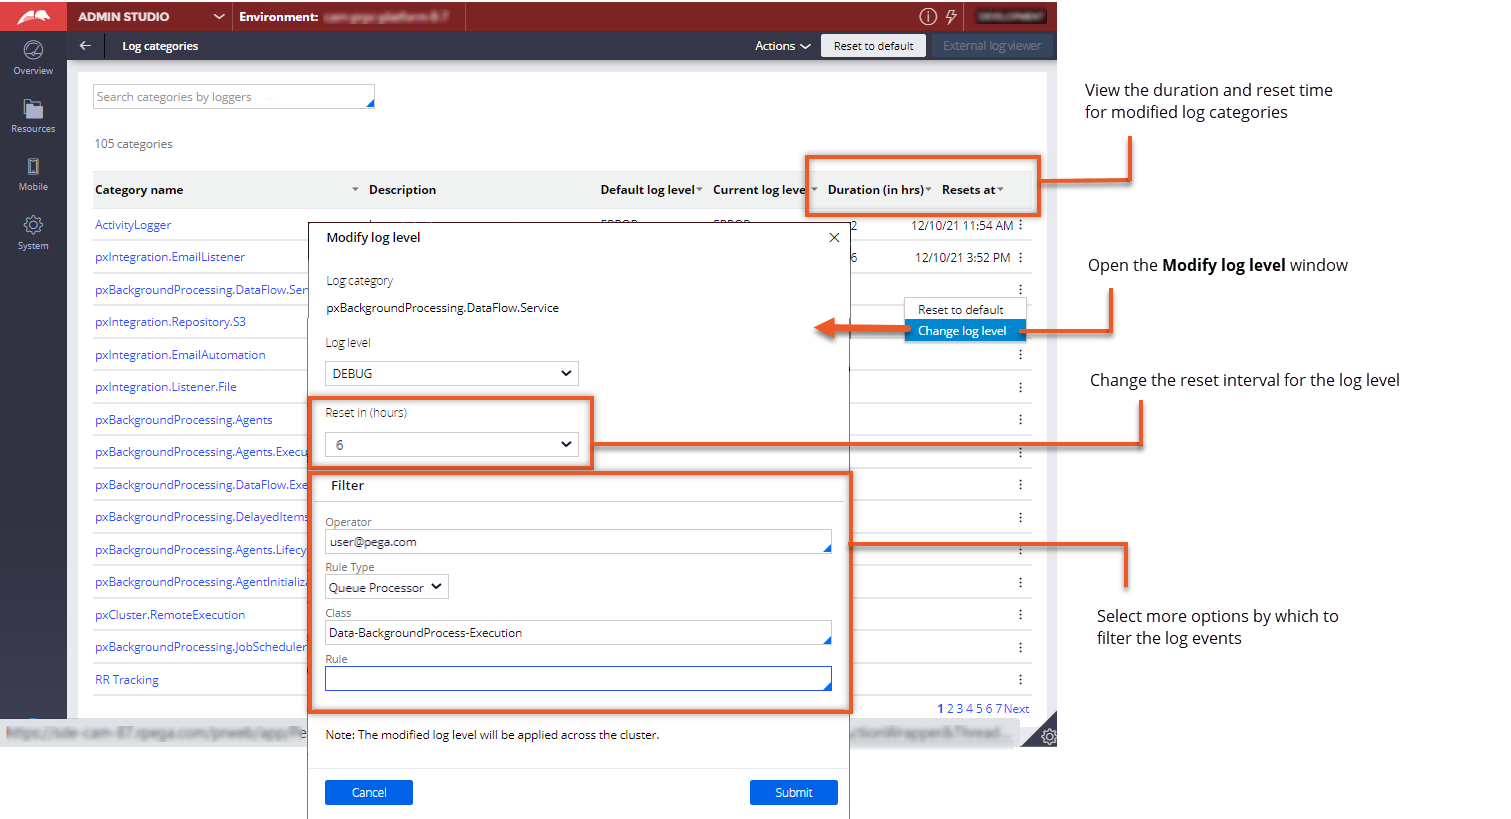
| Modify log levels in Admin Studio | You can modify log levels at the system level in Admin Studio. Changes are applied to all application nodes across the cluster. To open the Modify log levels window, in the navigation pane, click Resources, and then click Log categories. |
| Set automatic log level reset period | Log levels are automatically reset to the default level, ERROR, after two hours, which helps prevent excessive logging. You can increase the reset time by up to 24 hours for individual log categories that require additional time for debugging purposes. For clarity about when a log level will reset, the duration and reset time are included on the Log categories page. |
| Select additional options for filtering log events | More filtering options, such as Operator, are added for filtering log events. The additional filters enable you to create more focused logs during debugging. For example, you can select an operator by which to filter log entries. Log events are then generated for the selected operator only. |
The following figure shows the updated Log categories page and the Modify log level window in Admin Studio:

For more information, see Creating custom log categories and Temporarily changing logging events in log files.
Increased features and support for case archival
New features expand support for case archival and make it easier to adhere to your data retention policy.
New features for case archival
| Feature | Description |
| Support for on-premises and client-managed cloud deployments | You can now run the case archival process for on-premises and client-managed cloud Oracle, Microsoft SQL, and PostgreSQL databases. Use a supported repository, like the Pega File system or a client-managed AWS S3, for storing archived data for on-premises and client-managed cloud deployments. |
| Case exclusion | You can now place a hold on stand-alone cases and parent cases to prevent them from being archived, purged, and expunged from the database. Placing a hold on a case is useful when the case needs to be preserved for legal or audit purposes. Remove the hold on the case to once again include it in the archival process. |
Other improvements
| Description | |
| More details included in the Log archival summary | More archive details are included in the Log archival summary class to provide better monitoring of your archival process. |
| Theme Cosmos support for reviewing archived data | Theme Cosmos provides a more consistent and familiar UI for reviewing archived data. |
Support of archived case data in Search and Reporting Service
After you migrate from embedded Elasticsearch to Search and Reporting Service (SRS), you can search data that is saved to the Pega Cloud File storage during the case archival process.
During the case archival process, the pyPegaIndexer job indexes the archived data in Pega Cloud File storage to make it searchable in SRS.
You can view the archived data, but cannot modify it unless you first restore it to your database.
For more information, see Improving performance by archiving cases.
Seamless migration to Search and Reporting Service
After updating Pega Platform to version 8.7, the system provides the option to perform a zero-downtime migration from embedded Elasticsearch to Search and Reporting Service (SRS).
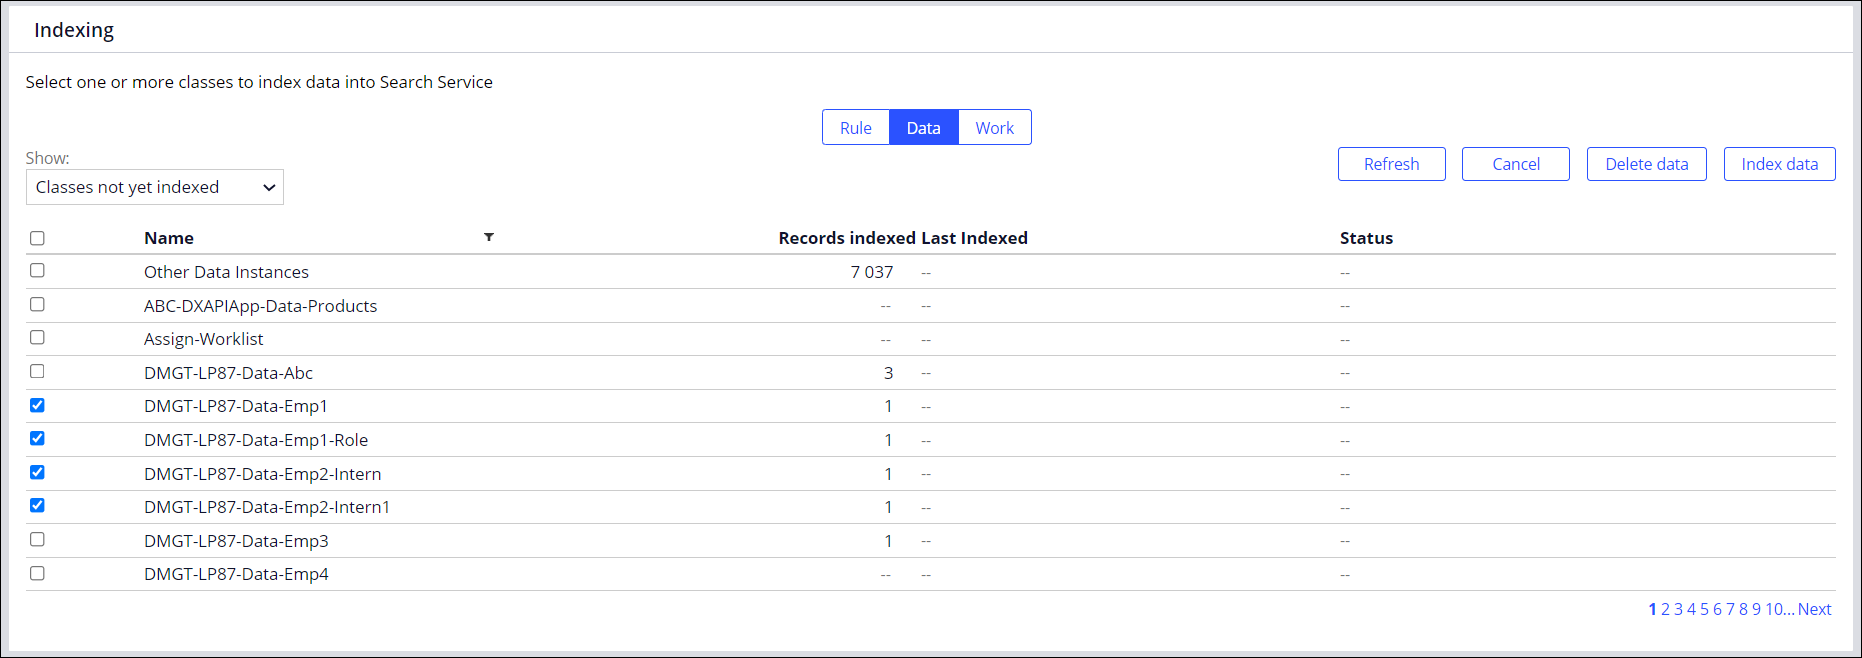
The migration is safe and ensures that the dataset from embedded Elasticsearch becomes instantaneously available in SRS. The process works in the background and does not affect users' ongoing work, such as making search queries or managing queue processors. When the migration finishes, the interface of the search landing page changes to reflect the SRS functionalities. For example, you can index certain classes to save time and system resources instead of indexing entire class type.
The following image presents an extract from the SRS landing page. Improved indexing provides users with the option to select a class type, and then index certain classes to make them available for search.

Deprecated support for Pega Platform deployments on embedded Kafka
Starting in Pega Platform 8.7, the use of the internal Kafka cluster as the Stream service is deprecated. On-premises systems that have been updated from earlier versions of Pega Platform can continue to use Kafka in embedded mode. However, to ensure future compatibility, do not create any new environments using embedded Kafka.
For information on how to configure Pega Platform to connect to an external Kafka cluster as the stream provider, see Configuring External Kafka as a Stream service.
Other enhancements
Read about minor enhancements in Pega Platform version 8.7.
Support for selecting all rulesets for a rule type in the Revalidate and Save utility
When you use the Revalidate and Save utility, you can now select all the rulesets that the rule type belongs to at the same time. Selecting all rulesets saves you time when you want to validate multiple rules, in multiple access groups, of a single rule type.
You can select all rulesets for the following rule types:
- Rule-Declare-DecisionTable
- Rule-Declare-DecisionTree
- Rule-Declare-Expressions
- Rule-Declare-Trigger
- Rule-Declare-Index
- Rule-Declare-OnChange
Support for specifying an access group to revalidate after an update
You can now define the context that the system uses to automatically revalidate and save rules after you update an application. To set the context, you specify the access group of the application on the Product rule form. Setting the context ensures that the system revalidates and saves rules with the correct application permissions.
Support for tracking search queries in Tracer
Starting from Pega Platform version 8.7, Search and Reporting Service provides the functionality to track search queries in the Tracer tool. When running a report definition, Tracer now shows specific information about your queries, such as the elapsed time of the query. You can analyze the search query to identify potential performance issues.
For more information, see Viewing Tracer results in the Tracer window.
Increased insight into memory allocation
The following changes provide increased insight into memory allocation to help troubleshoot performance issues that can cause memory problems.
- The new Bytes Allocated column is displayed on the System Performance landing page in Performance Analyzer (PAL). The column displays the total memory allocated for a requestor interaction.
- Pega Platform generates the PEGA0133 alert when the amount of memory allocated for an interaction exceeds the defined threshold for the requestor type.
For more information, see Using the summary display of Performance Analyzer and PEGA0133: Allocated memory threshold reached.
New queue processing alert: Too many items in ready-to-process state
Pega Platform now generates alert PEGA0134 when the number of items that are ready to process exceeds the threshold value configured for the queue processor. The alert message includes the queue processor name, partition, and other relevant information that a system administrator needs to troubleshoot the processing backlog. You can configure the PEGA0134 alert for each queue processor.
For more information, see PEGA0134: Too many items in ready-to-process state.
New queue processing alert: Ready-to-process items not picked up by the queue processor
Pega Platform now generates alert PEGA0137 when items that are ready to be processed are not picked up by the queue processor within an expected length of time. The alert message includes the processor name, partition, and other relevant information that a system administrator needs to troubleshoot the performance issue. You can configure the PEGA0137 alert for each queue processor.
For more information, see PEGA0137: Ready-to-process items not picked up by queue processor.
Enhancement to queue processing: Automatic handling of large message exceptions
Queue processing now supports automatic handling of large messages that exceed the Kafka default threshold. Pega queue processing uses the Kafka stream service to queue and delegate processing. A large message could contain text for an HR email notification, for example.
When Kafka generates an exception for a message larger than the new default of 5MB, Pega queue processing now automatically saves the original message content in a large message storage and replaces it with an object reference. This lets the message enter Kafka queue, but as a small message containing only the link to the storage location where the actual message content is kept and allows the Kafka flow to maintain performance.
This feature is available by default on Pega Cloud. To make it available in another environment, you must configure a platform repository. You use new dynamic system settings to enable or disable the feature, change the name of the large message repository, and change the default base path in the repository.
For more information, see Large message exception handling in queue processing.
Previous topic What's new in security 8.7 Next topic What's new in user experience 8.7
