Dashboards
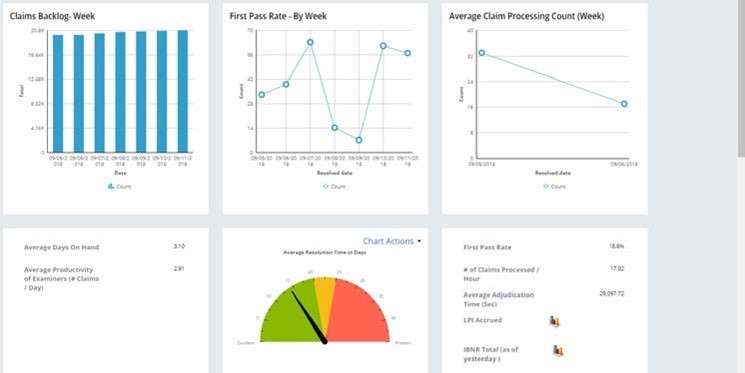
Claims manager dashboard
The claims manager dashboard displays rolling weekly, monthly, and yearly claims data with event code usage and occurrence frequencies. The dashboard layout can be customized with selected widgets to provide the manager with the reports or SLAs important to them.
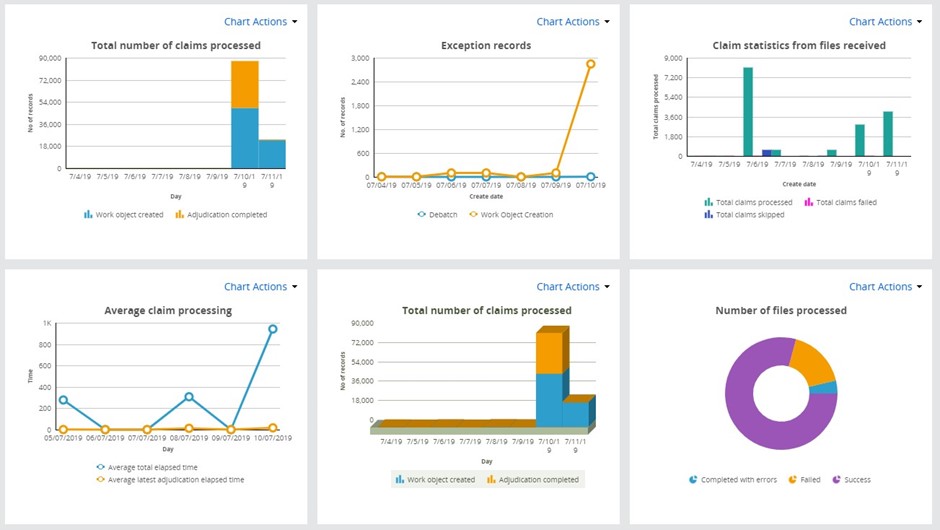
System manager dashboard
The system manager dashboard shows the health of the Smart Claims Engine. This dashboard displays a series of reports to track claim throughput, errors, processing volume and SLA’s. Drill down reports are also available from this dashboard to provide more information on any issues reported.
Previous topic Testing suite Next topic Primary data entities