Editing a report
Adapt to dynamic needs and continuously improve your reporting capabilities by modifying your reports. You can change the way your report displays information or filters data for different audiences.
For example, in a financial report, you can filter the data to retrieve information about the income of your company generated within certain period.- If App Studio is not in Preview mode, in the header, click Preview application.
- In the header of App Studio, select the portal in which you manage reports.
- In the navigation pane, open the Report Browser by clicking Reports.
- Select the reports that you want to view:
- To view your custom reports, click the My Reports tab.
- To view all available reports, click the All reports tab.
- Click a report to edit.
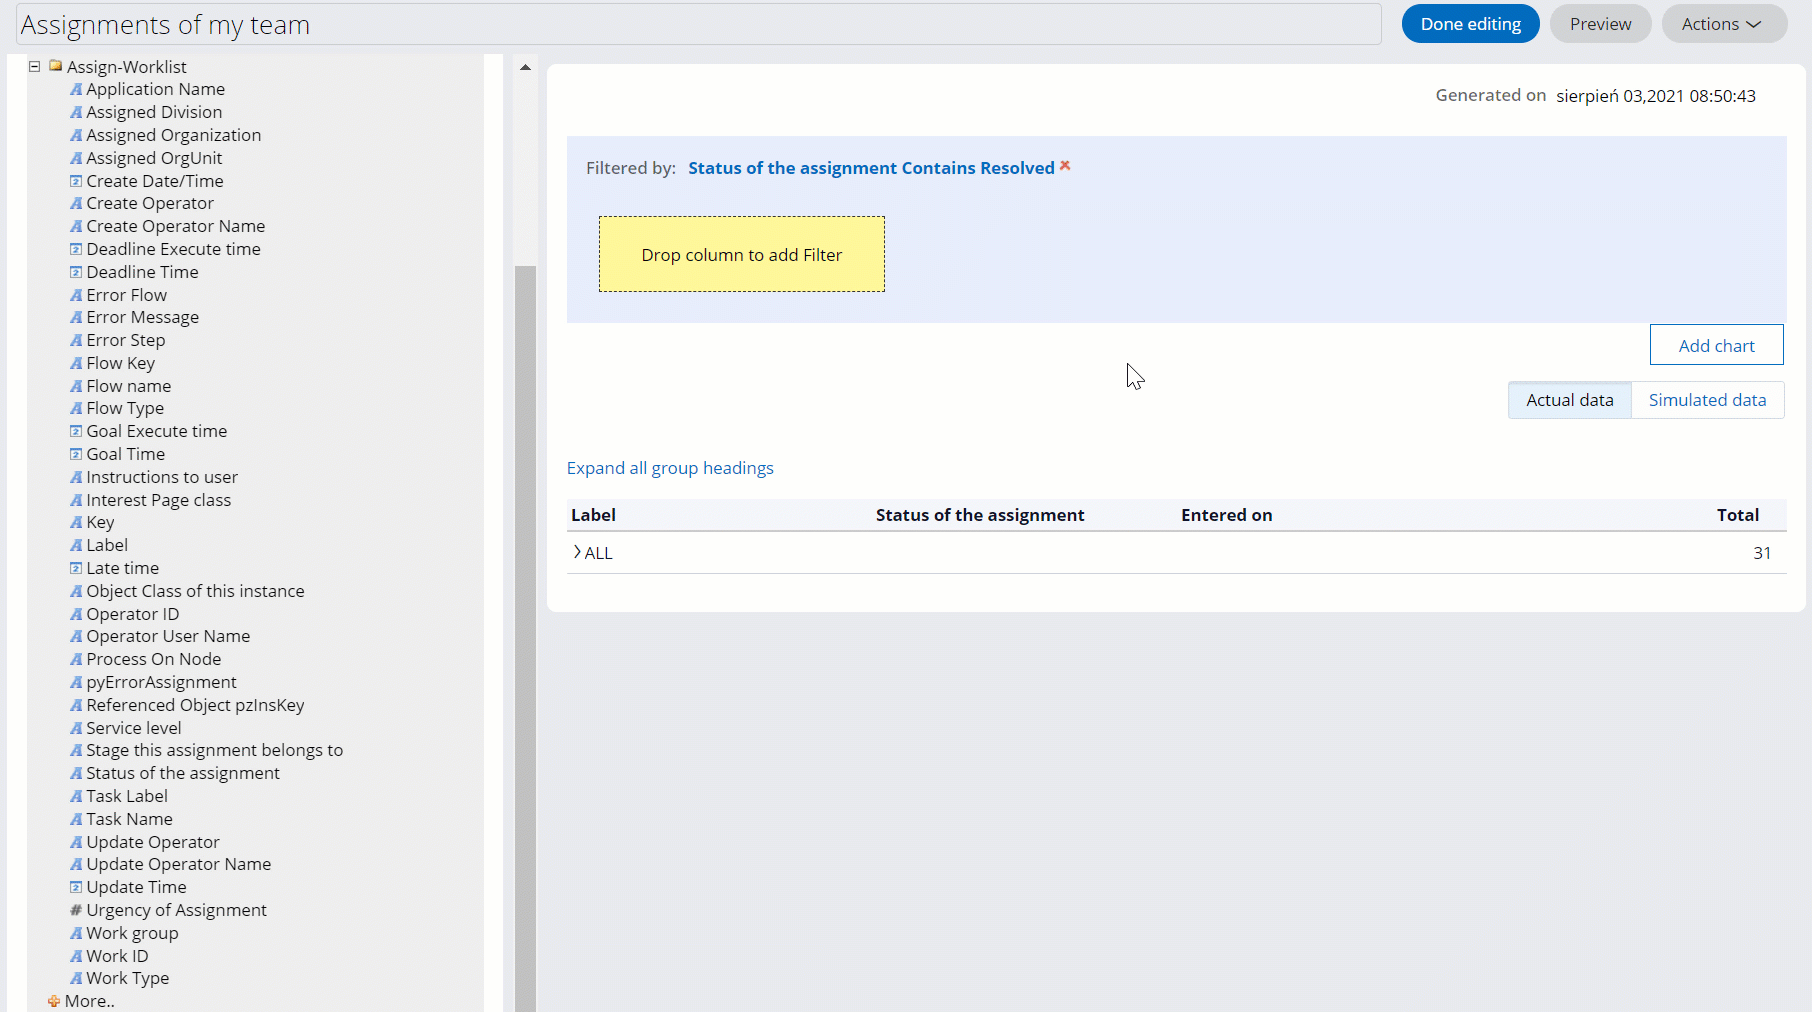
- In the upper-right corner, click Edit report, and edit the
report:
Choices Actions Change the report title At the top of the Report Editor, in the text field, enter a new report title. Add a column to the report From the Data Explorer section, drag the column next to an existing report column. Remove a column from the report - Right-click the report column, and then click Delete.
- In the Delete Column Confirmation modal dialog box, click Submit.
Change the column heading - Right-click the report column, and then click Heading.
- In the Column heading field, enter the column name, and then click Apply changes.
Format the column values - Right-click the report column, and then click Format.
- In the Format values field, enter appropriate value, and then click Apply changes.
Sort the column values - Right-click the report column, and then click Sort.
- If you want to display values in ascending order, click Lowest to highest.
- If you want to display values in descending order, click Highest to lowest.
Add a chart to the Summary or Chart report type - Click Add chart.
- Click All chart types.
- In the Select Chart Type modal dialog box, click a chart type that you want to include in the report.
- Click Submit.
- From the Available columns section, drag the columns into the chart.
- Click Apply changes.
Edit the report chart - If a chart already exists, click Edit chart.
- Click Title to change the chart title.
- Click Color settings to customize the chart colors.
- Click General settings to set general chart settings.
- Click Apply changes.
Filter the columns content - From the Data Explorer section, drag the filter into the Drop column to add Filter box.
- In the Edit filter section, set filter options, and then
click Apply changes.For more information about filter conditions, see Editing filter conditions.
Switch between simulated and actual data Depending on your business need, click Actual data or Simulated data. - Click Done editing.
- Report Editor
Report Editor provides options for managing the content of reports. You can update reports with specific columns to meet your business needs. For example, in a report that lists resolved cases, you can insert a column that contains information about exceeded deadlines to identify areas that require improvement.
- Modifying list reports
Manage the appearance and content of list reports by modifying the column settings in the Report Viewer. For example, you can filter the content to display in columns, sort the data, or adjust column widths to make the most relevant data easier to see.
- Modifying summarized reports
Adjust the appearance and contents of summarized reports by modifying the column settings in the Report Viewer. For example, you can specify the format of values, or change the column width.
- Adding filter conditions
Decide what data you want to present in your reports by adding filter conditions that provide options to display only relevant information. For example, you can filter a report to display sales from a specific year, to analyze purchase tendencies over time.
- Adding or editing charts in the Report Editor
Display a graphical representation of the report data by adding a chart to the report in the Report Editor. For example, you can include a chart to make the report more readable by featuring specified data sets.
- Removing charts in the Report Editor
Save space by removing redundant charts from summarized reports in the Report Editor. For example, you can remove a chart when you delete the data that the chart uses.
- Converting a list report to a summarized report
Analyze the numerical data to discover the number of particular events in an application by converting a list report to a summarized report. For example, you can summarize the total number of user IDs in the application.
- Converting a summarized report to a list report
Make your report more readable and your data analysis more efficient by displaying the summarized columns of a report in the form of a list. For example, you can view a list of all open cases to verify the remaining workload.
Previous topic Removing scheduled reporting tasks Next topic Report Editor