Analysis dashboards
The dashboard is your primary source of insight into your Auto-balancing data. The Analysis dashboard contains various robot activity metrics across work groups that collectively provide a reporting solution to help you measure the performance of your RPA work force, and enable timely and accurate administrative actions.
The dashboard consists of multiple interactive charts that provide daily insight into the overall performance of your robotic work force, as well as detailed information about work groups and individual robots in your application.Daily summary
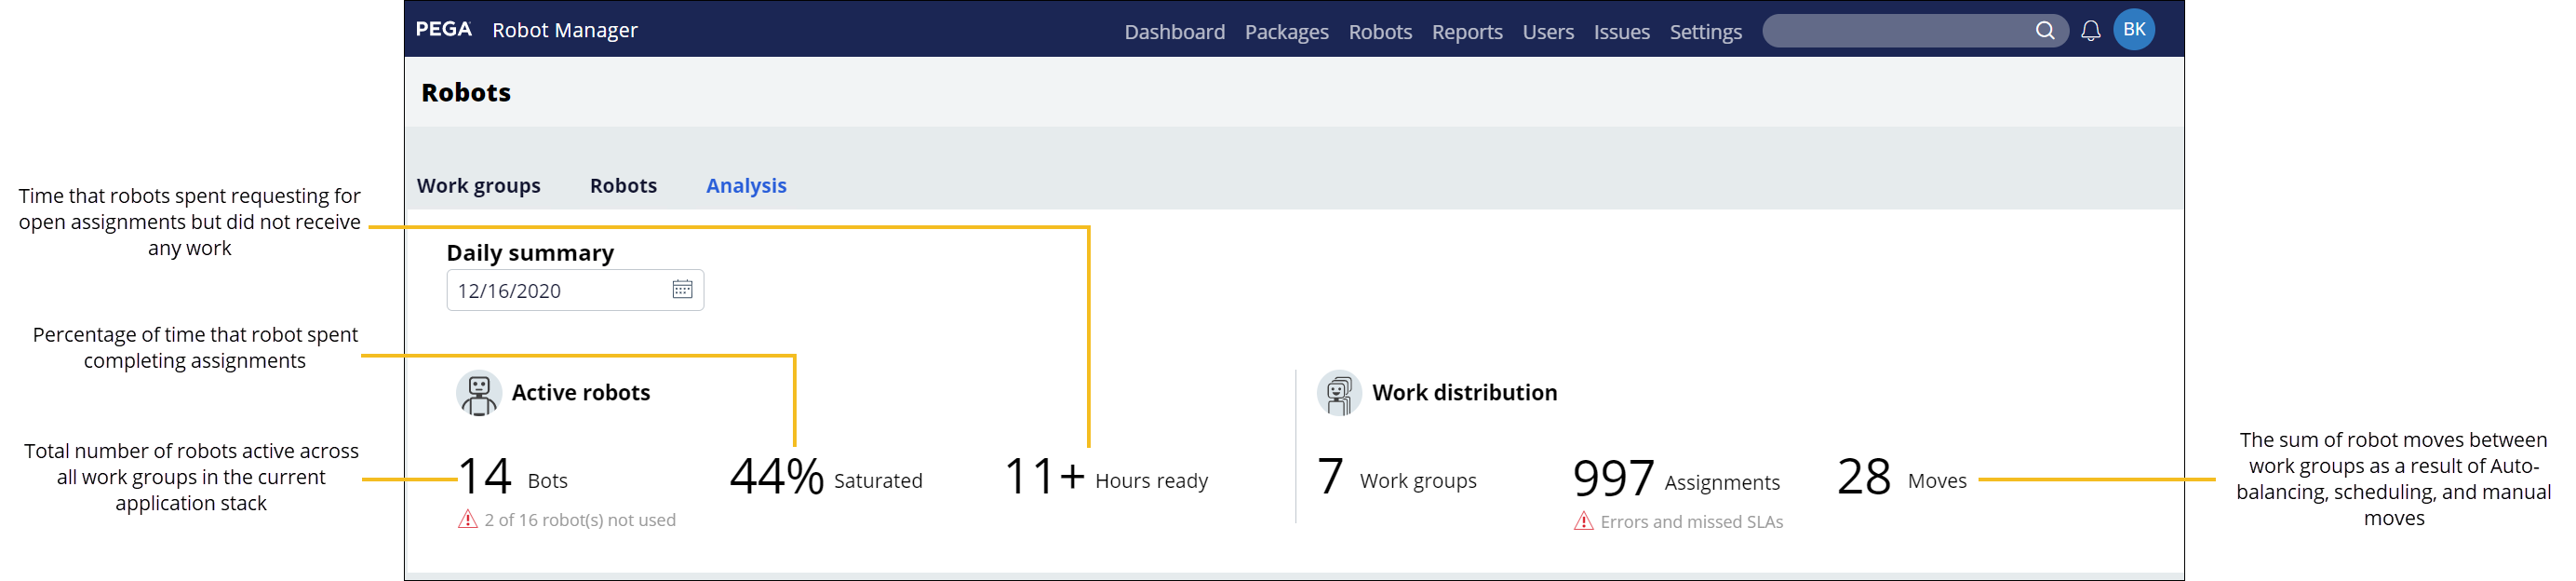
The Daily summary widget provides the high-level activity metrics of your robotic work pool for a specific date. Based on the date that you select, the widget displays the number of robots that are active across all work groups, the percentage of time that the robots spent working on completing assignments, and how much time robots spent ready for new work assignments, but none were available. In addition, you can view the number of assignments completed across work groups and how many times robots moved between work groups.
Daily analysis
The Daily analysis section provides multiple categories of detailed performance data for robots or work groups in the form of interactive diagrams and charts. You can toggle between Robots and Work groups views, depending on the type of data that you want to display.
Robot volumes and work group volumes
Provides an hourly display of how workloads changed across work groups in relation to the number of assigned robots or completed assignments, depending on the selected view.
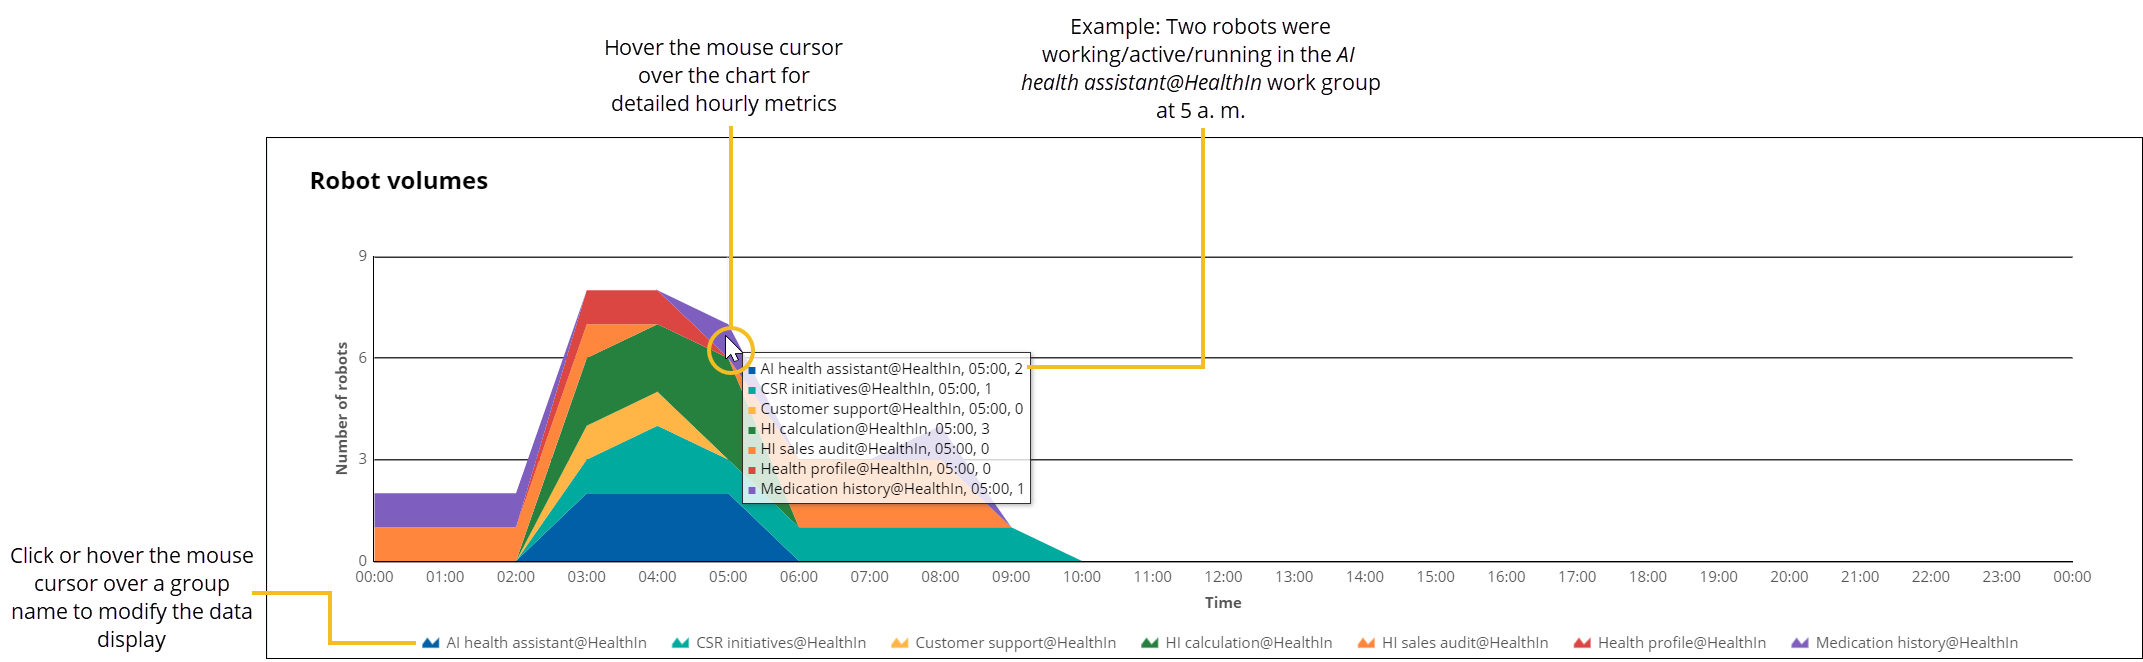
By analyzing robot and work volumes data, you get a clear view into how robots work and how they are being used.
Robot activity
Available in the Robots view, the Robot activity chart provides detailed information about which robots worked in a work group, when and how they were started, and how the robots' status changed as their time in the work group progressed.
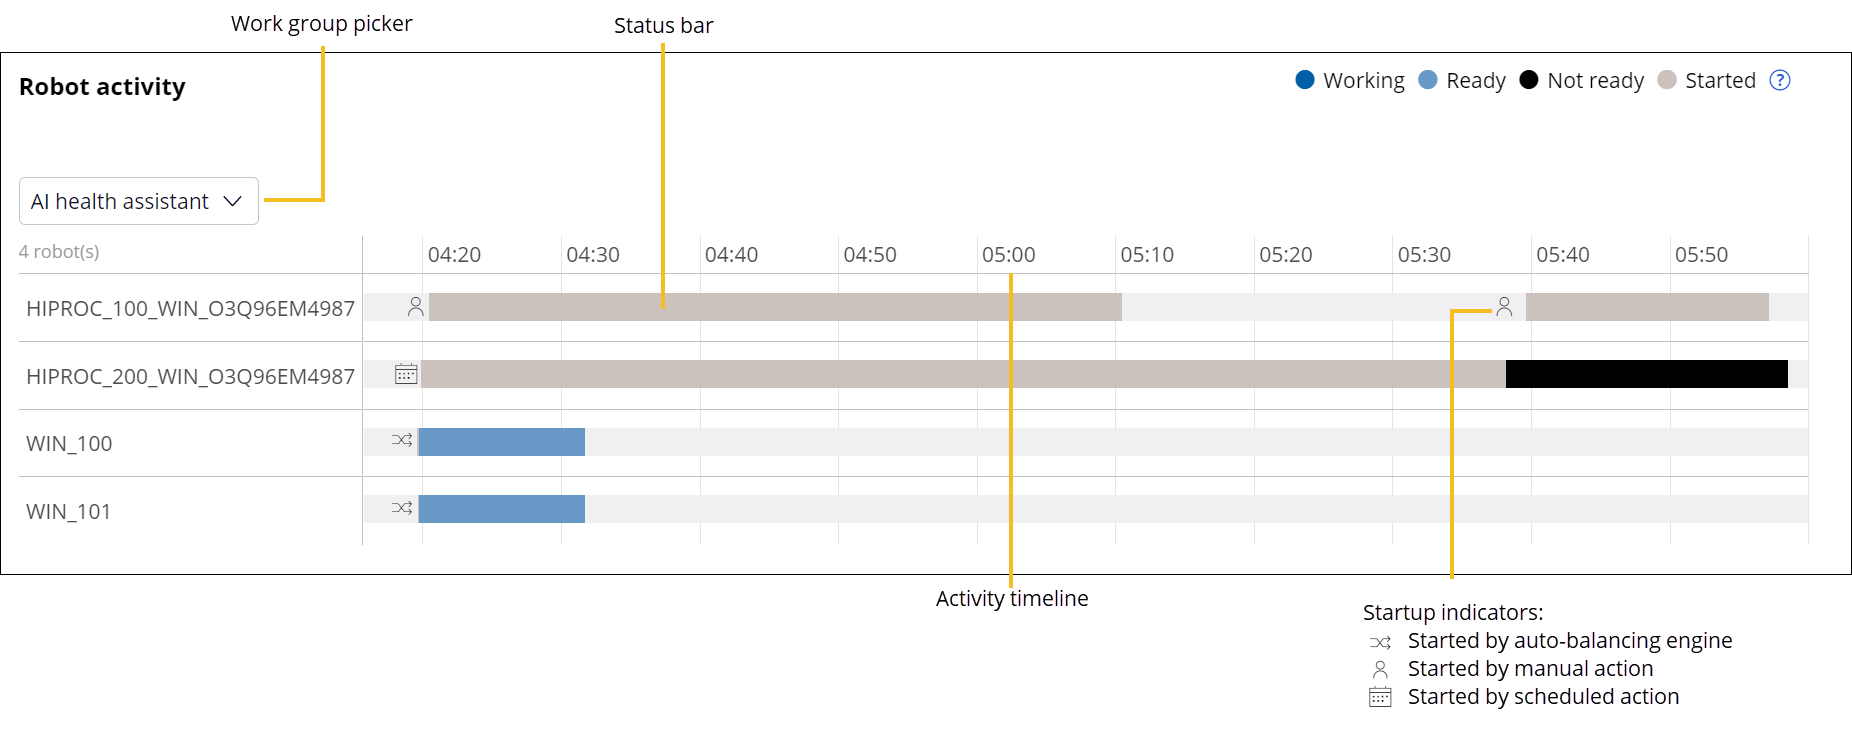
Use the robot activity data provided to better understand how your robots are used throughout the day. For example, if scheduled robots spend more time requesting new assignments than working, this might indicate that you need fewer robots to efficiently process the incoming work. Freeing up unneeded robots so that they are available for other work groups means that the robots will be more efficient.
For more information and a sample use case that demonstrates how to read the Robot activity chart, see Robot activity chart.
Performance
Available in the Work groups view, this chart provides a high-level performance breakdown for each work group, accompanied by the number of assignments, process time, and rates of missed SLAs and errors.
You can collect various types of operational intelligence by investigating the Performance chart. Your observations can help you increase the efficiency of your robotic workforce. For example, if you created a schedule and the robots are spending a significant amount of time in the Ready state, it might indicate that you have over-provisioned the work group’s schedule. If you have no schedules but the amount of time that robots spend in the Ready state is still high, you might want to enable the work group for Auto-balancing, so that robots can be transferred to other groups instead of being idle.
In addition, the Performance chart data might point to some system issues. For example, an increased amount of time the robots spend in the Not ready state is indicative of Pega Robot Runtime issues, because robots cannot access all target applications, or because the automation needs fixing.
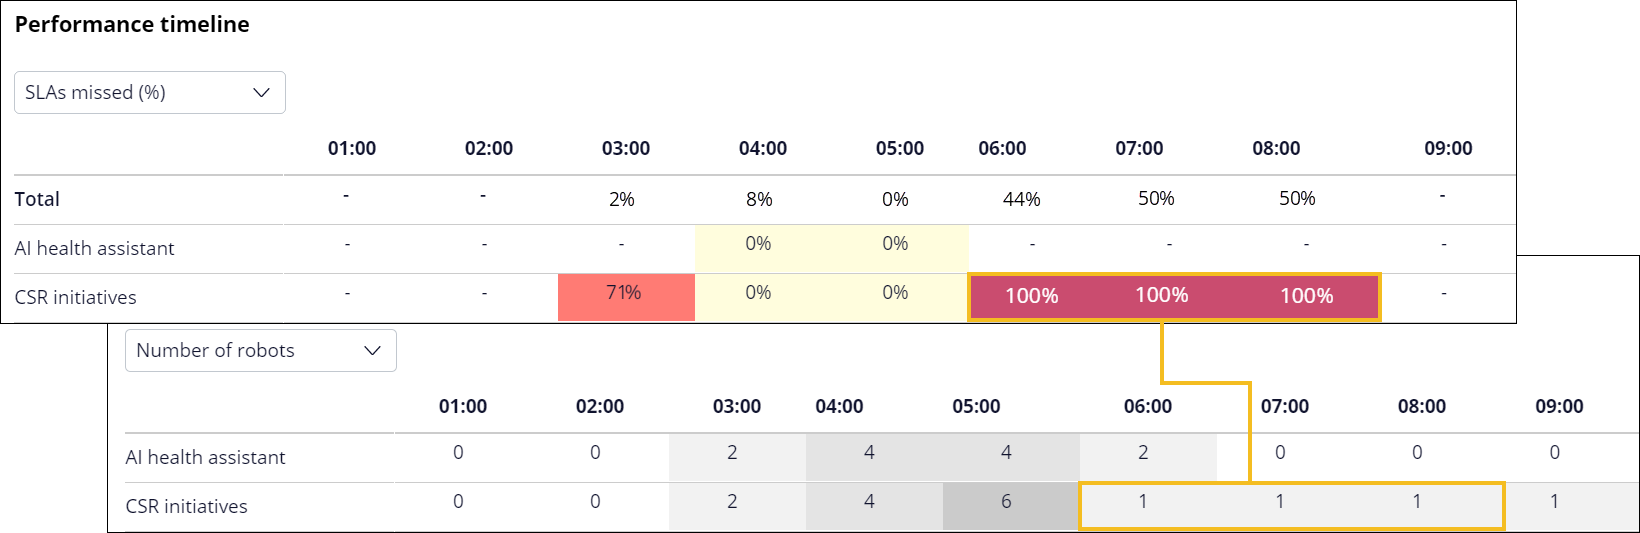
Performance timeline
Available in the Work groups view, this chart provides an hourly breakdown of how your robots were utilized across work groups during the day. Various types of operational metrics facilitate tracking of whether your robotic workforce is achieving its business goals. Color-coded data is presented in a visually appealing way, which simplifies tracking the automation success rates and detecting potential issues or bottlenecks in your operational results.
For more information, see Performance timeline metrics.
As demonstrated in the following figure, you can view the percentage of SLAs missed at a specific time of day in a work group. You can correlate this data with the number of robots that worked in that work group at the time when the SLAs were missed. Then, you can check whether the data from previous days suggests a trend. Based on the insight that you gained, you might want to turn on Auto-balancing for the work groups, schedule robots to work in that work group, or increase its SLA priority.
- Robot activity chart
The Robot activity chart provides a graphical breakdown of robot performance in a work group on a specific date. Learn how to read the chart by analyzing a sample use case.
- Performance timeline metrics
The Performance timeline widget contains various types of operational metrics to help you assess the performance of your robotic workforce on an hourly basis.
- Robot status types
Keep the condition of robots in check through robot activity status indicators that are available in the Robot activity chart.
Previous topic Analyzing auto-balancing data Next topic Robot activity chart