Dashboard management
Increase the productivity of your team by configuring a dashboard that consolidates and presents relevant data in the most convenient form. For example, you can design a workspace that includes several reports that help managers oversee work by displaying case status, sales data, and burn down report widgets.
At run time, end users can personalize their dashboard instance to display information according to their specific preferences and interact with data in the most convenient way.
In Theme Cosmos applications, you can use two types of dashboard components:
- The traditional dashboard component that uses a section-based My Dashboard page, which is an out-of-the-box custom page.
- The new Cosmos React dashboard component, which is a React-based landing page with the dashboard template. For more information, see Configuring a dashboard
In Cosmos applications, you can create a React-based landing page that uses the dashboard template. The Cosmos React dashboard component is a curated experience. Consequently, the application designers specify what users see when they log in. Personalization at run time is not possible. For more information, see Configuring a dashboard.
Traditional dashboard component
By default, Pega Platform uses role-based interfaces, which includes a dashboard tailored to a role. For example, when a user with the Manager role signs in to a Pega Platform application, the user is presented with a dashboard that is tailored to include information necessary to manage the users who complete the work.
The developer can configure the dashboard, which is available as a custom page in an application, for a role by publishing changes to the default dashboard. For example, the manager might see the number of open cases and overdue assignments in order to better manage the workload of their direct reports. End users can then access the published default dashboard that is assigned to their role.
End users can personalize their dashboard by switching templates and adding or removing widgets from slots. A template defines the layout of a dashboard and divides the workspace into slots. Slots are containers for one or more widgets, which are elements of the user interface that group summary information and Key Performance Indicators (KPIs) from different sources and present them in an actionable format. If end users personalize a dashboard, changes that developers publish to a default dashboard do not overwrite or reset the personalized dashboard of the end users.

Changing the dashboard template
Find basic information that you need more efficiently by organizing your dashboard layout in a comprehensive and transparent way. Dashboards that offer quick access to information that is necessary for a particular role can help increase productivity.
For example, in sales operations, the manager role needs a more comprehensive dashboard to accommodate more data tracking tools than a sales representative, who might benefit from trimming down a too-elaborate dashboard.- Log in to an end-user portal, for example, the User Portal.
- In the navigation menu of your application, click Dashboard.
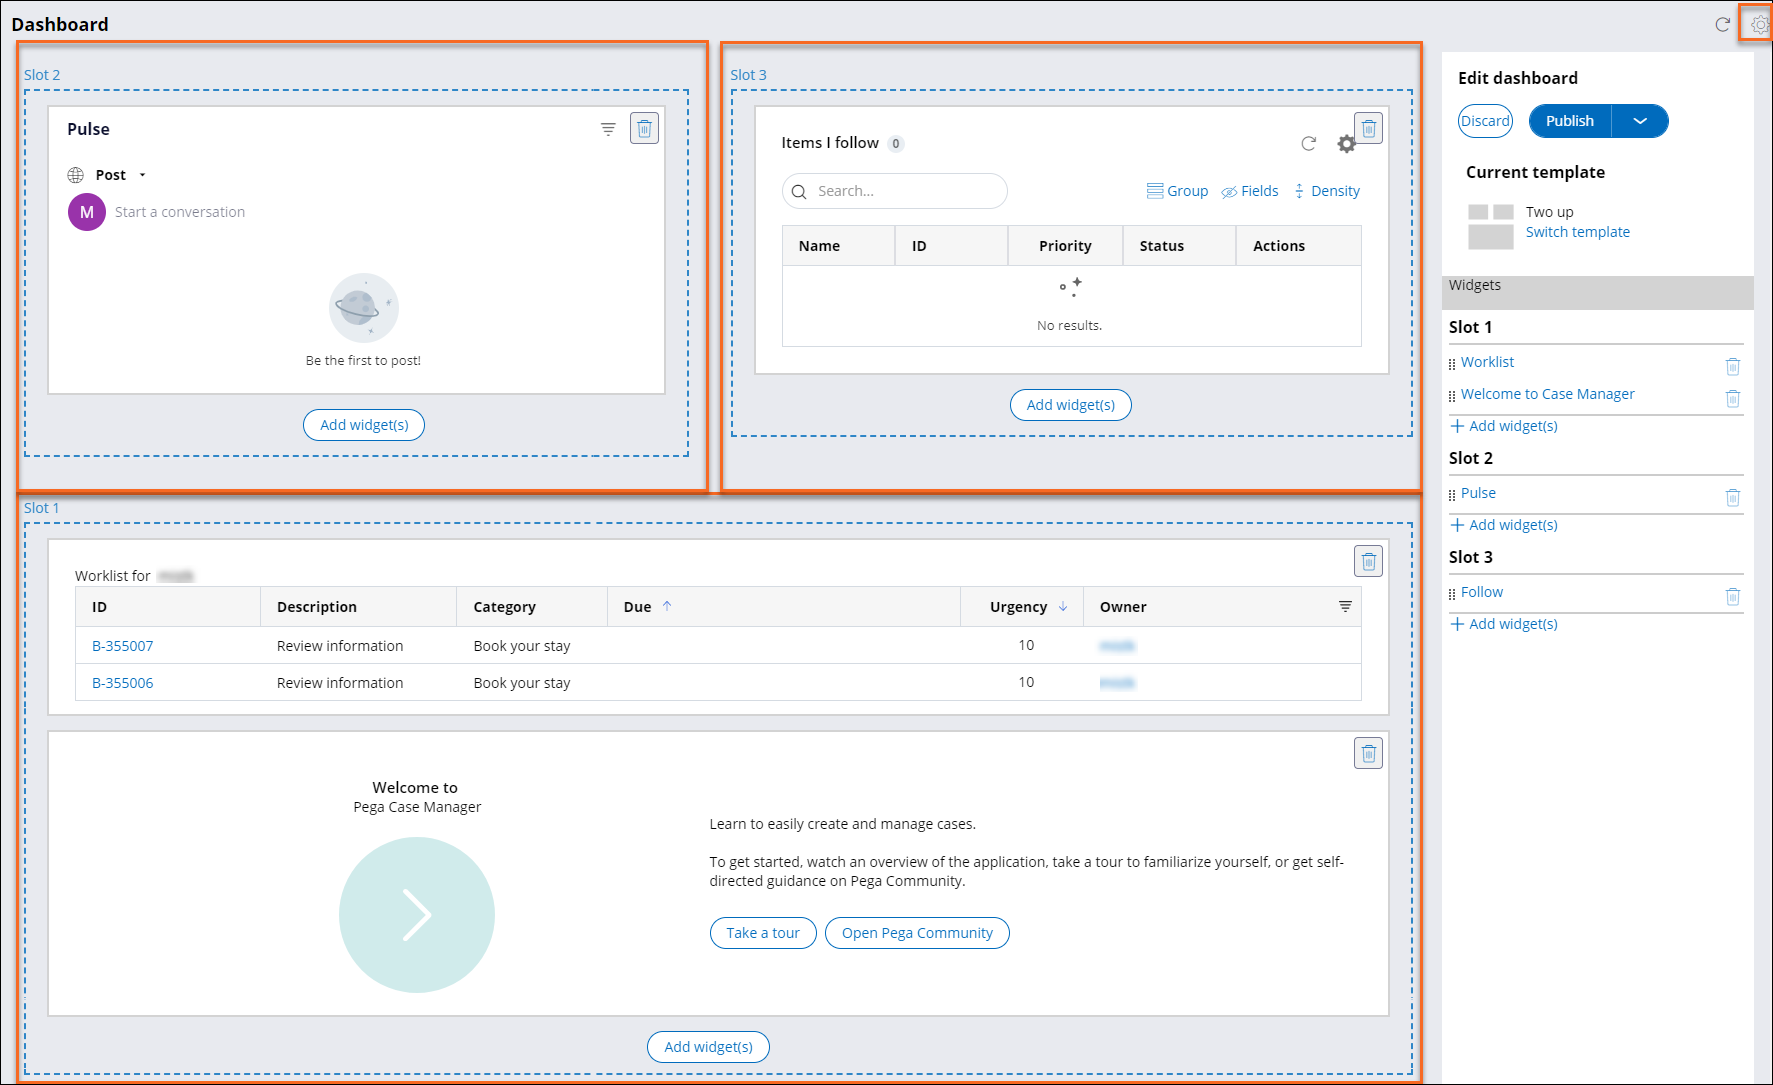
- In the upper-right corner of your workspace, click the Personalize the dashboard icon.
- In the Edit dashboard pane, click Switch template.
- In the Select a template modal dialog box, select the template that you want to use.
- Click Publish.
Adding a widget to your dashboard
Increase the productivity of your team by personalizing the dashboard with widgets that display relevant information, such as charts or shortcuts to reports and frequently used resources.
For example, you can design a workspace that includes a widget for frequently used reports to help managers save time and oversee their projects.- In the navigation menu of your application, click Dashboard.
- In the upper-right corner of the work space, click the Personalize the dashboard icon.
- In the Edit dashboard pane, choose a widget:
- In the slot where you want to position the widget, click Add widget(s).
- In the Add widgets to slot modal dialog box, select one or
more widgets that you want to add to the slot, and then click Add
selected.
For example: Click Report widget, which you can configure to provide you with quick access to selected reports from your application and display that data as a grid or a chart. Case volume report, selected within Report widget 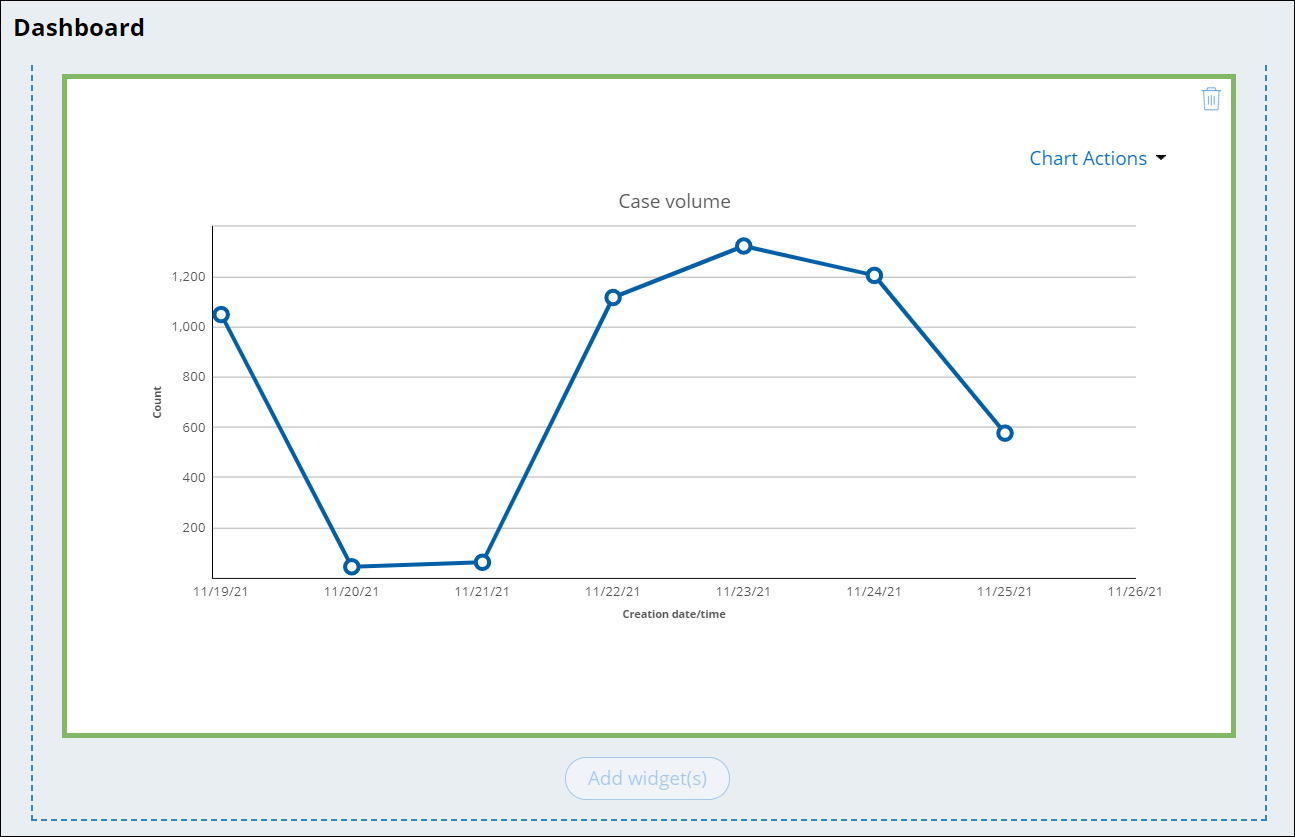
- Optional: To change the position of the widget in the work area, drag the widget into a new position or a different slot by following the guide markers that are displayed on the screen.
- Optional: To remove any of the widgets, click the Delete this widget icon.
- In the work area, hover over the newly added widget, and then determine whether there
are additional options to configure:
Choices Actions Click to edit message on hover - Click the widget.
- In the Edit dashboard pane, edit the widget with the configuration controls.
- Click Save.
- Click Publish.
No options message on hover Click Publish.
Dashboard widgets
A dashboard widget displays operational information about your application and key performance indicators, such as the number of assigned items or the average time to resolve a case. By personalizing your dashboard with widgets that are relevant to your role, you can increase productivity.
The following table lists the widgets that you can add to your dashboard in a Theme Cosmos application:
| Widget | Description | Configurable |
| Case lifecycle | Displays the stages and steps for each case type in your application. | No |
| Case Manager shortcuts | Provides shortcuts to the Reports and Get next work items. | No |
| Cases entered by me | Displays all cases that you create. | No |
| Case status | Renders a pie chart that breaks down cases by stage. | No |
| Connected Apps | Displays a list of third-party apps and their connection status. You can also connect and disconnect apps from a service provider. | No |
| My Cases | Displays all open cases to which you are a party. Options include changing the title of the widget and the visibility of the Quick Create option. | Yes |
| Nearby Cases | Displays cases within a maximum radius of 50 miles from your current
location. Options include selecting the case type and the Location property. | Yes |
| Recents | Displays a list of cases that you recently updated or opened. | No |
| Team members | Displays the users in your work group and the number of their open assignments. | No |
| Teams | Displays a list of teams within your work group. | No |
| Work queues | Displays a list of work queues in your application. | No |
| Worklist | Displays a list of work items that are assigned to you. Options include changing the source of the list to a specific work queue or work group. | Yes |
| Data Imports - In-progress | Displays the details of currently running data imports. | No |
| Data Imports - Recently completed | Displays the details of recently completed data imports. | No |
| Achievement Tracker | Displays badges that you receive by accomplishing specific tasks in the product. | No |
| Google Maps | Displays a map that shows your current location and open assignments. Options include selecting an automatic or fixed height for the map. | Yes |
| Welcome to Pega Express | Displays introductory information about the product and an overview video. | No |
| Welcome to Case Manager | Displays introductory information about the portal and an overview video. | No |
| Manage Change | Displays data types that are delegated to you by a manager. Options include setting the visibility of the widget title. | Yes |
| Recent reports | Displays a list of reports that you ran recently. Click a report title to view the result data. | No |
| Report widget | Displays the results of a specific report. Options include setting a report category and name. | Yes |
| Pulse Activity Feed | Displays the Pulse activity gadget that displays Pulse posts made by the user. | No |
Previous topic Configuring teams Next topic Collaborating on cases