Monitoring the Stream service
Ensure that your Stream service operates without causing any errors by regularly monitoring the status of your Stream nodes, partitions, disk space, CPU usage, and database availability.
Landing page
You can do a simple, manual status check of the Stream service by going to the Stream landing page.
In the header of Dev Studio, click .
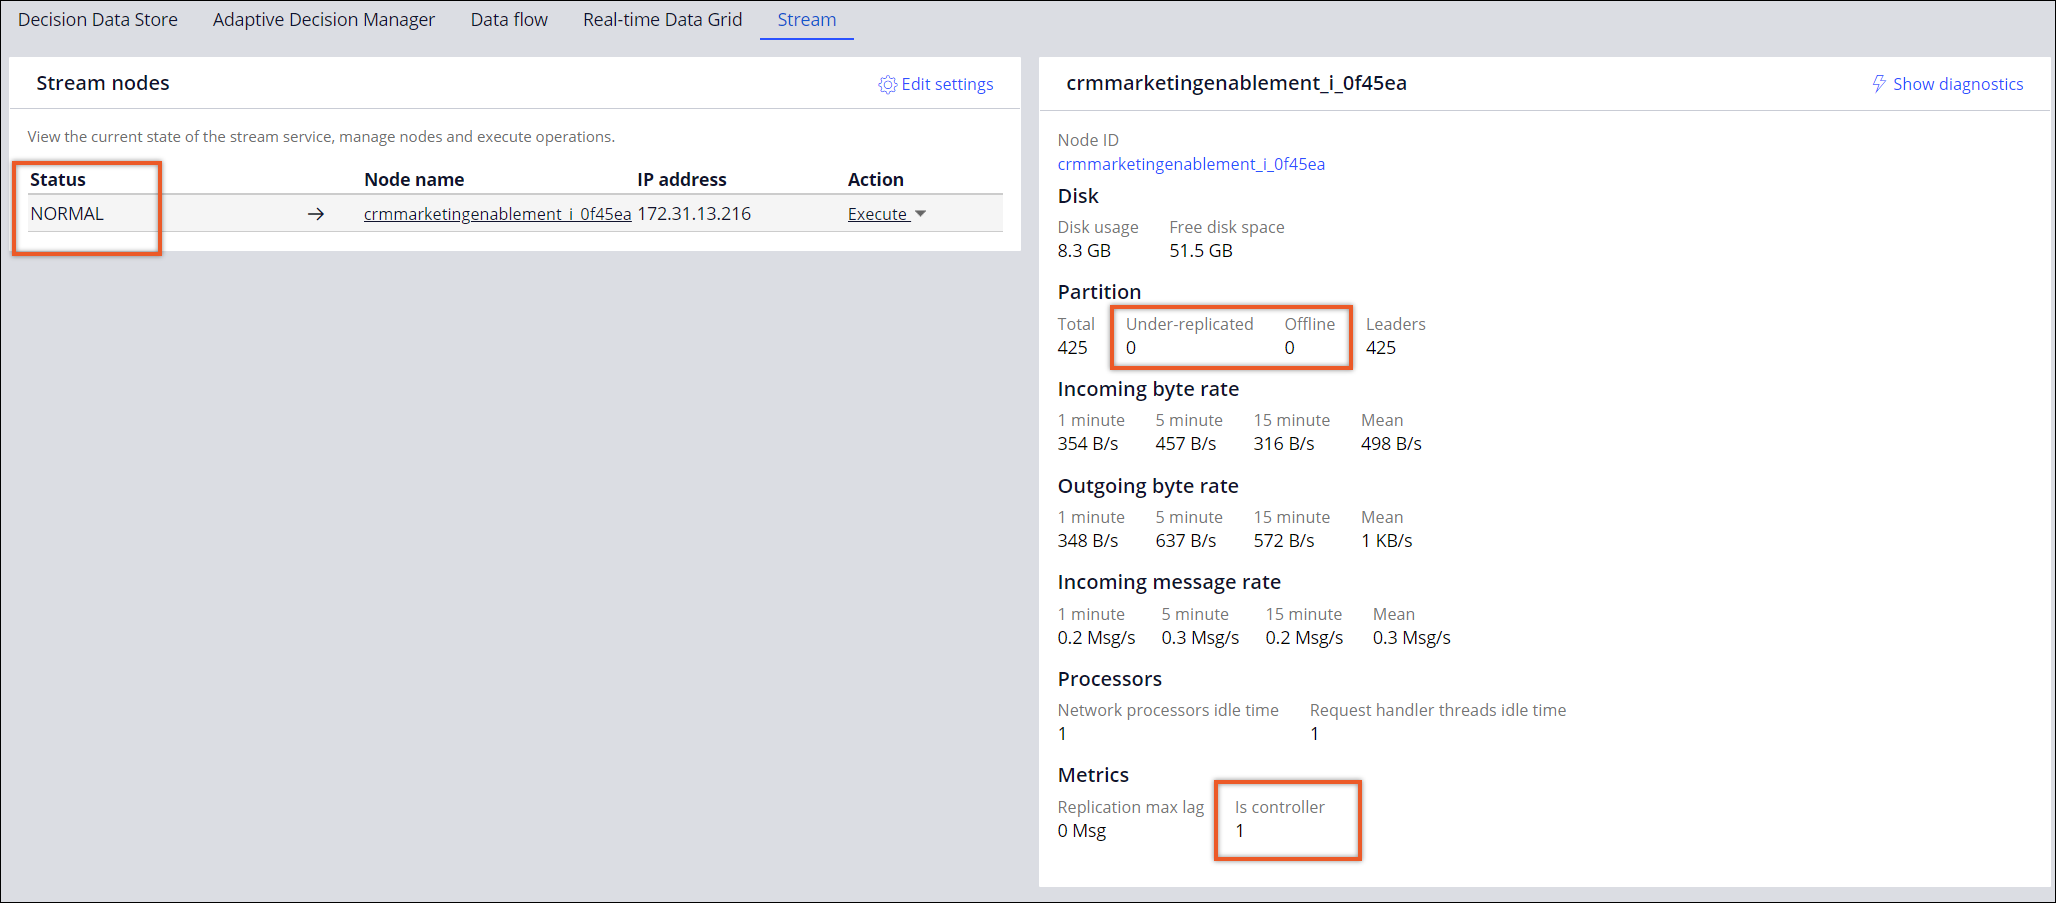
Ensure that:
- Status of each stream node is NORMAL.
- There are no offline partitions.
- There are no under-replicated partitions.
You might see some under-replicated partitions from time to time, however, the value must stay 0 most of the time. If you constantly see under-replicated partitions, that might indicate that the Stream service is undersized. In this case, look at the CPU of your stream nodes. if CPU is averaging above 80%, consider scaling up your Stream nodes cluster.
- There is exactly one node for which the Is controller
parameter is set to 1.
If you see no controller nodes, or there is more than one controller node, perform a rolling restart of Stream nodes. A controller node is responsible for managing the states of partitions, replicas and for performing administrative tasks like reassigning partitions in case of a failure. For more information, see Operating the Stream service.
- The total number of partitions does not exceed 1,000.
Maximum number of partitions per broker
There is a known limit on the number of partitions per broker. The limit depends on the configuration of the machine that the broker is running on. As a general rule, limit the number of partitions per broker to 1,000. When more than 1,000 partitions per broker are configured, issues with the synchronization of partition replicas might occur and lead to under-replicated partitions. The limit of 1,000 partitions is valid for the internal Kafka in Pega Cloud. For the specific numbers in other environment types, see the following table:
Maximum supported partitions per broker in relation to CPU and memory
| Machine type | Maximum supported partitions per broker |
| CPU (core): 2, Memory (GiB): 2 | 300 |
| CPU (core): 2, Memory (GiB): 8 | 1,000 |
| CPU (core): 4, Memory (GiB): 16 | 1,000 |
| CPU (core): 8, Memory (GiB): 32 | 2,000 |
| CPU (core): 16, Memory (GiB): 64 and up | 4,000 |
Health check
Monitor Pega Platform instances by associating a health check with every node in a cluster. Take unhealthy nodes out of the service and restart them.
For more information, see Verifying that an instance is running.
Disk space
The Stream service uses the disk to store data. Monitor disk usage to prevent running out of disk space. If a Stream node runs out of disk space, it stops functioning until space is available again. This situation leads to data loss and overall service instability.
Monitor the available disk space and take actions, for example, increase disk space, when the availability of free space drops below 30%.
CPU
Monitor the CPU usage on every Stream service node. If the CPU average usage is above 70%, consider provisioning a bigger node.
Database
The Stream service relies on the availability of the Pega Platform database. A slow or unavailable database might have a serious impact on the Stream service.
Monitor queries to the following tables:
- pr_data_stream_sessions
- pr_data_stream_nodes
- pr_data_stream_node_updates
If queries take more than 1 second, consider tuning your database.
In the case of database unavailability, planned or unplanned, consider restarting your stream nodes, especially if you see them being unhealthy.
File descriptors
If you encounter the following issues while monitoring the stream service:
- Stream nodes are getting terminated.
- Stream node terminates and fails to start.
- The number of file descriptors in use increases constantly.
``` 2022-02-16
                    10:37:14,737] ERROR Error while accepting connection (kafka.network.Acceptor)
                    java.io.IOException: Too many open files at
                    sun.nio.ch.ServerSocketChannelImpl.accept0(Native Method) ~[?:1.8.0_144] at
                    sun.nio.ch.ServerSocketChannelImpl.accept(ServerSocketChannelImpl.java:422)
                    ~[?:1.8.0_144] at
                    sun.nio.ch.ServerSocketChannelImpl.accept(ServerSocketChannelImpl.java:250)
                    ~[?:1.8.0_144] at kafka.network.Acceptor.accept(SocketServer.scala:414)
                    ~[kafka_2.11-1.1.0.9.jar:?] at
                    kafka.network.Acceptor.run(SocketServer.scala:357) [kafka_2.11-1.1.0.9.jar:?] at
java.lang.Thread.run(Thread.java:748) [?:1.8.0_144] ```Previous topic File descriptor limits Next topic Operating the Stream service