Explore Data tool
Managers can use the Explore Data tool to generate ad hoc reports and charts, called insights. Insights display interaction and service request data. You create the insights in a chart or table format, and then you select criteria for grouping and filtering the data. You can apply multiple layers of grouping, called dimensions, in order to view data at different levels, for example, monthly interactions for all CSRs, monthly interactions for one CSR, and monthly interactions of one type for one CSR. The Explore Data tool is available only to Pega Cloud clients because this tool requires that the Insights Reporting cloud service is provisioned for the client.
Check for Explore Data readiness
Before using the Explore Data tool tool, verify that your application meets the requirements to run this tool. Operators with Manager access see the Explore Data tool on the Home menu of the Interaction Portal.
- Log in to Dev Studio, and then select your application.
- Configure your application to use react-based landing pages if it is not
already configured to use that feature.
- In the header of Dev Studio, click .
- Scroll to the bottom of the page, and then expand the
Advanced section.The following figure shows the settings for the UI Runtime fields when the application is configured to use react-based landing pages:
UI Runtime settings 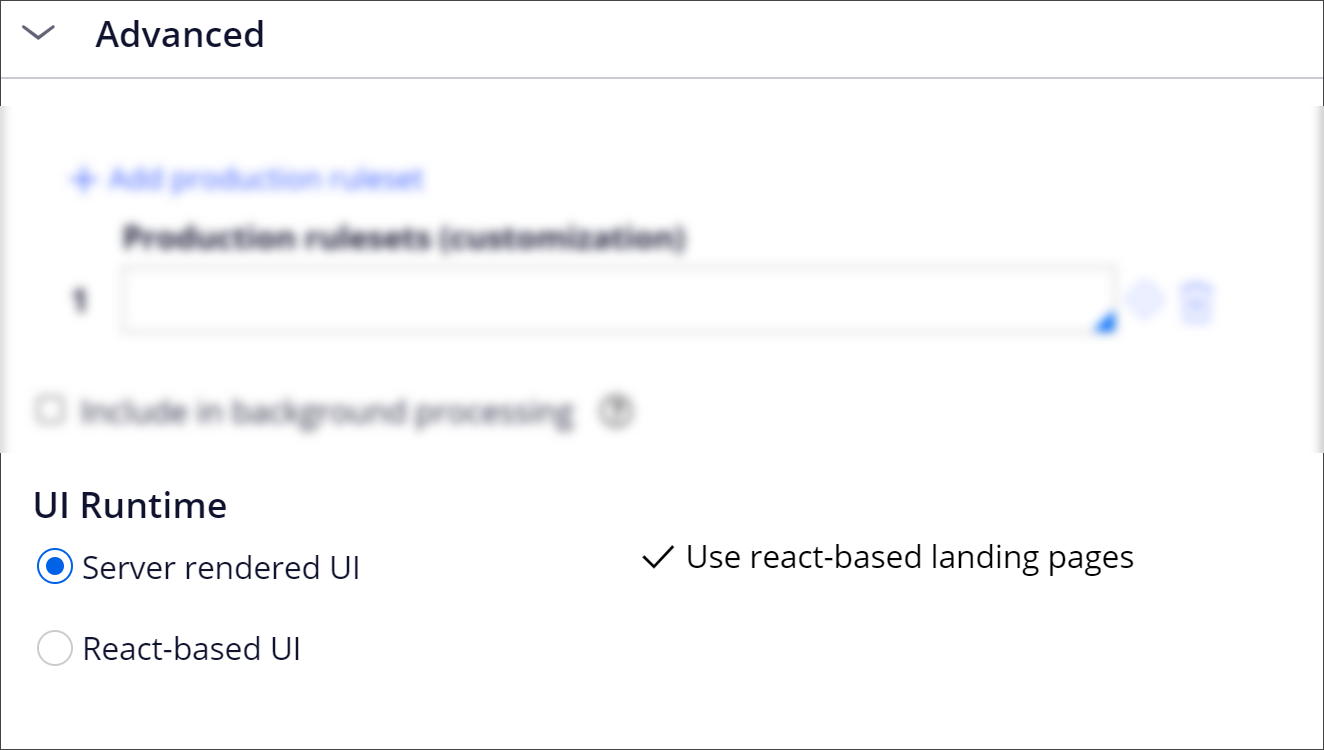
- If your application does not use react-based landing pages, click Enable react-based landing pages, and then click Save.
- Verify that the Pega-UIEngine ConstellationSvcURL dynamic
system setting has been configured with the URL for the Constellation UI
Service.
- In the header of Dev Studio, search for, and then open the Pega-UIEngine ConstellationSvcURL dynamic system setting.
- Verify that the dynamic system setting is configured with the
Constellation UI Service URL that you received in your Pega Cloud
service provisioning email.
If the value is blank, enter the Constellation UI Service URL, and then click Save.
The following figure shows the dynamic system setting for the Constellation UI service:
Dynamic system setting for the Constellation UI service 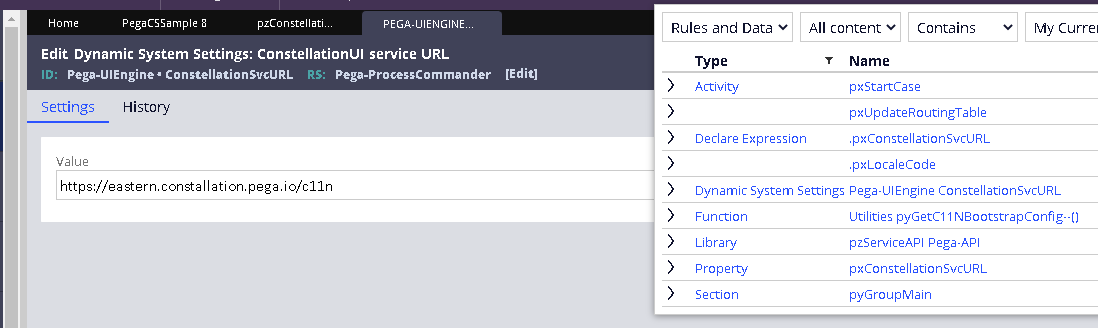
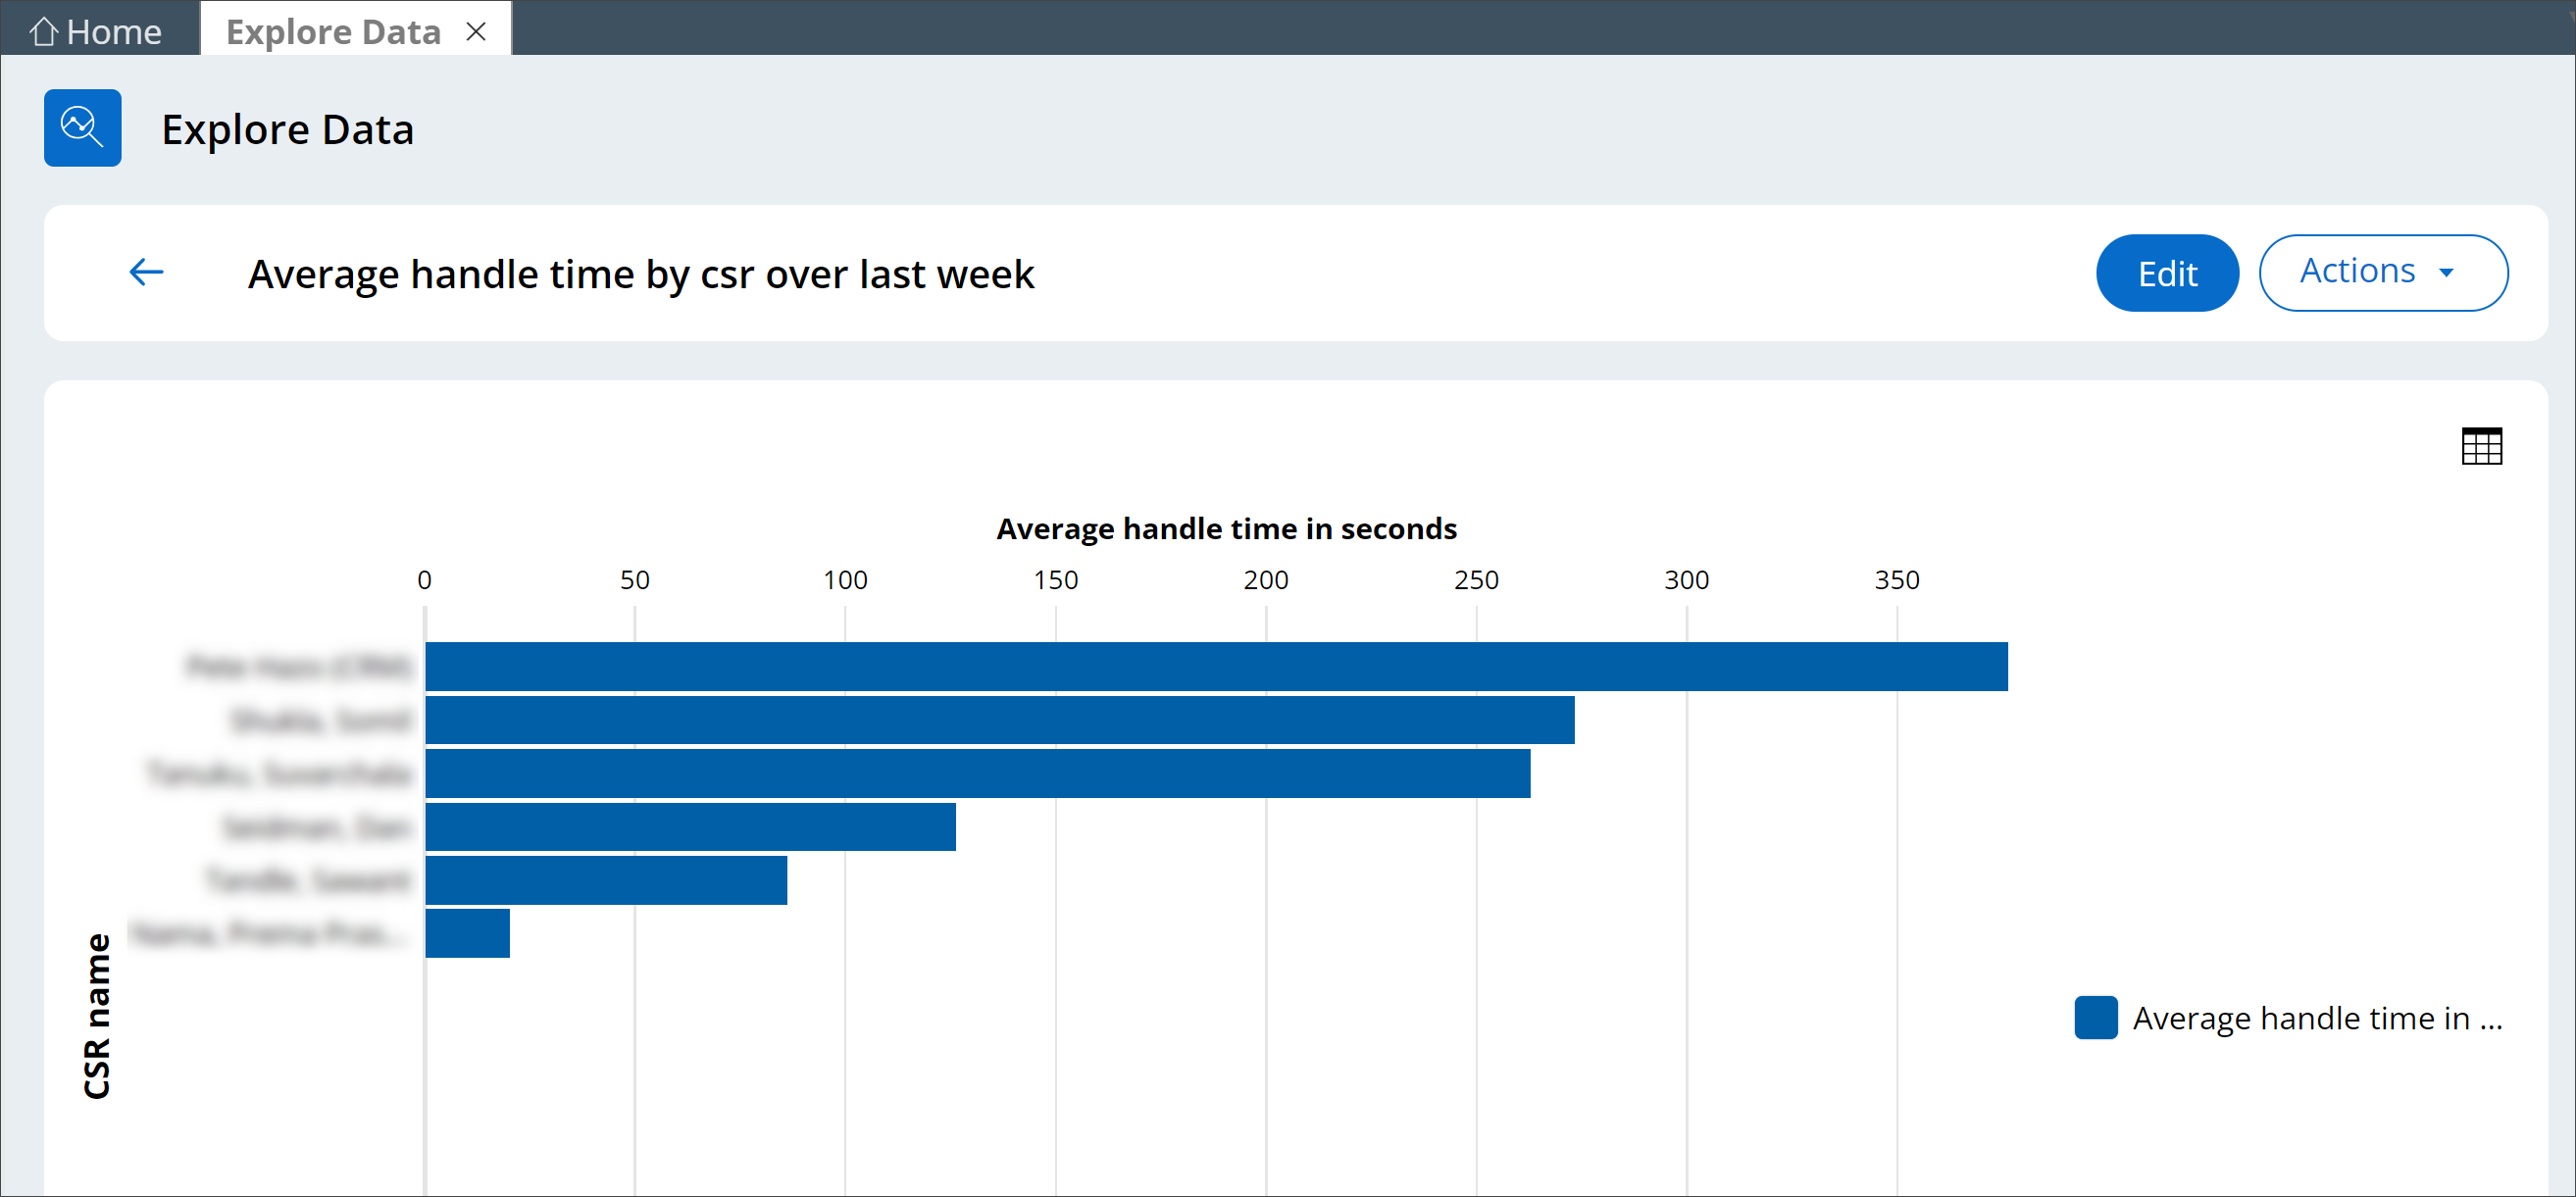
Creating customer service insights
You can create insights using interaction and case data. The application includes sample insights that show average handle time (AHT) by CSR, channel, and interaction. Use the sample reports as a starting point for new insights, or create your own new insights.
- Log in to the Interaction Portal as a manager.
- In the Home pane, click Explore Data.
- Choose one of the following actions:
To view an insight, for example, one of the sample insights, click the insight name.
To create an insight, select Interaction or a case type in the What would you like to explore list, and then follow the steps in Creating insights to filter and group the selected data.
- After you open an insight, explore the options for viewing data,
including:
- Click a shape or link to drill down for more details.
- Change the chart type ().
- Change the criteria used to group data ().
- Add filters, such as a date or date range ().
- Change the chart appearance (Chart tab).
- To change the insight name or visibility (Public or
Private), click .
- After you view or edit insights, choose one of the following actions:
- To save a new insight or to save your changes to an insight, click Save Insight.
- To save your changes as a new insight, click .
- To cancel changes, and then return to the Explore Data window, at the upper-left of the page, click Cancel.
- To view the insight at a higher level, at the upper-left of the chart, click the Go back a level arrow icon.
- To return to the insights list, at the upper-left of the page, click the Go back arrow.
Previous topic Configuring the Estimated Application Savings report Next topic Pega Customer Relationship Management suite of applications