Monitoring predictions
Analyze how successful your predictions are in predicting the outcomes that bring value to your business. Gain insights by reviewing metrics for predictions and the models that drive them.
Prediction Studio provides the following metric types:
- Performance
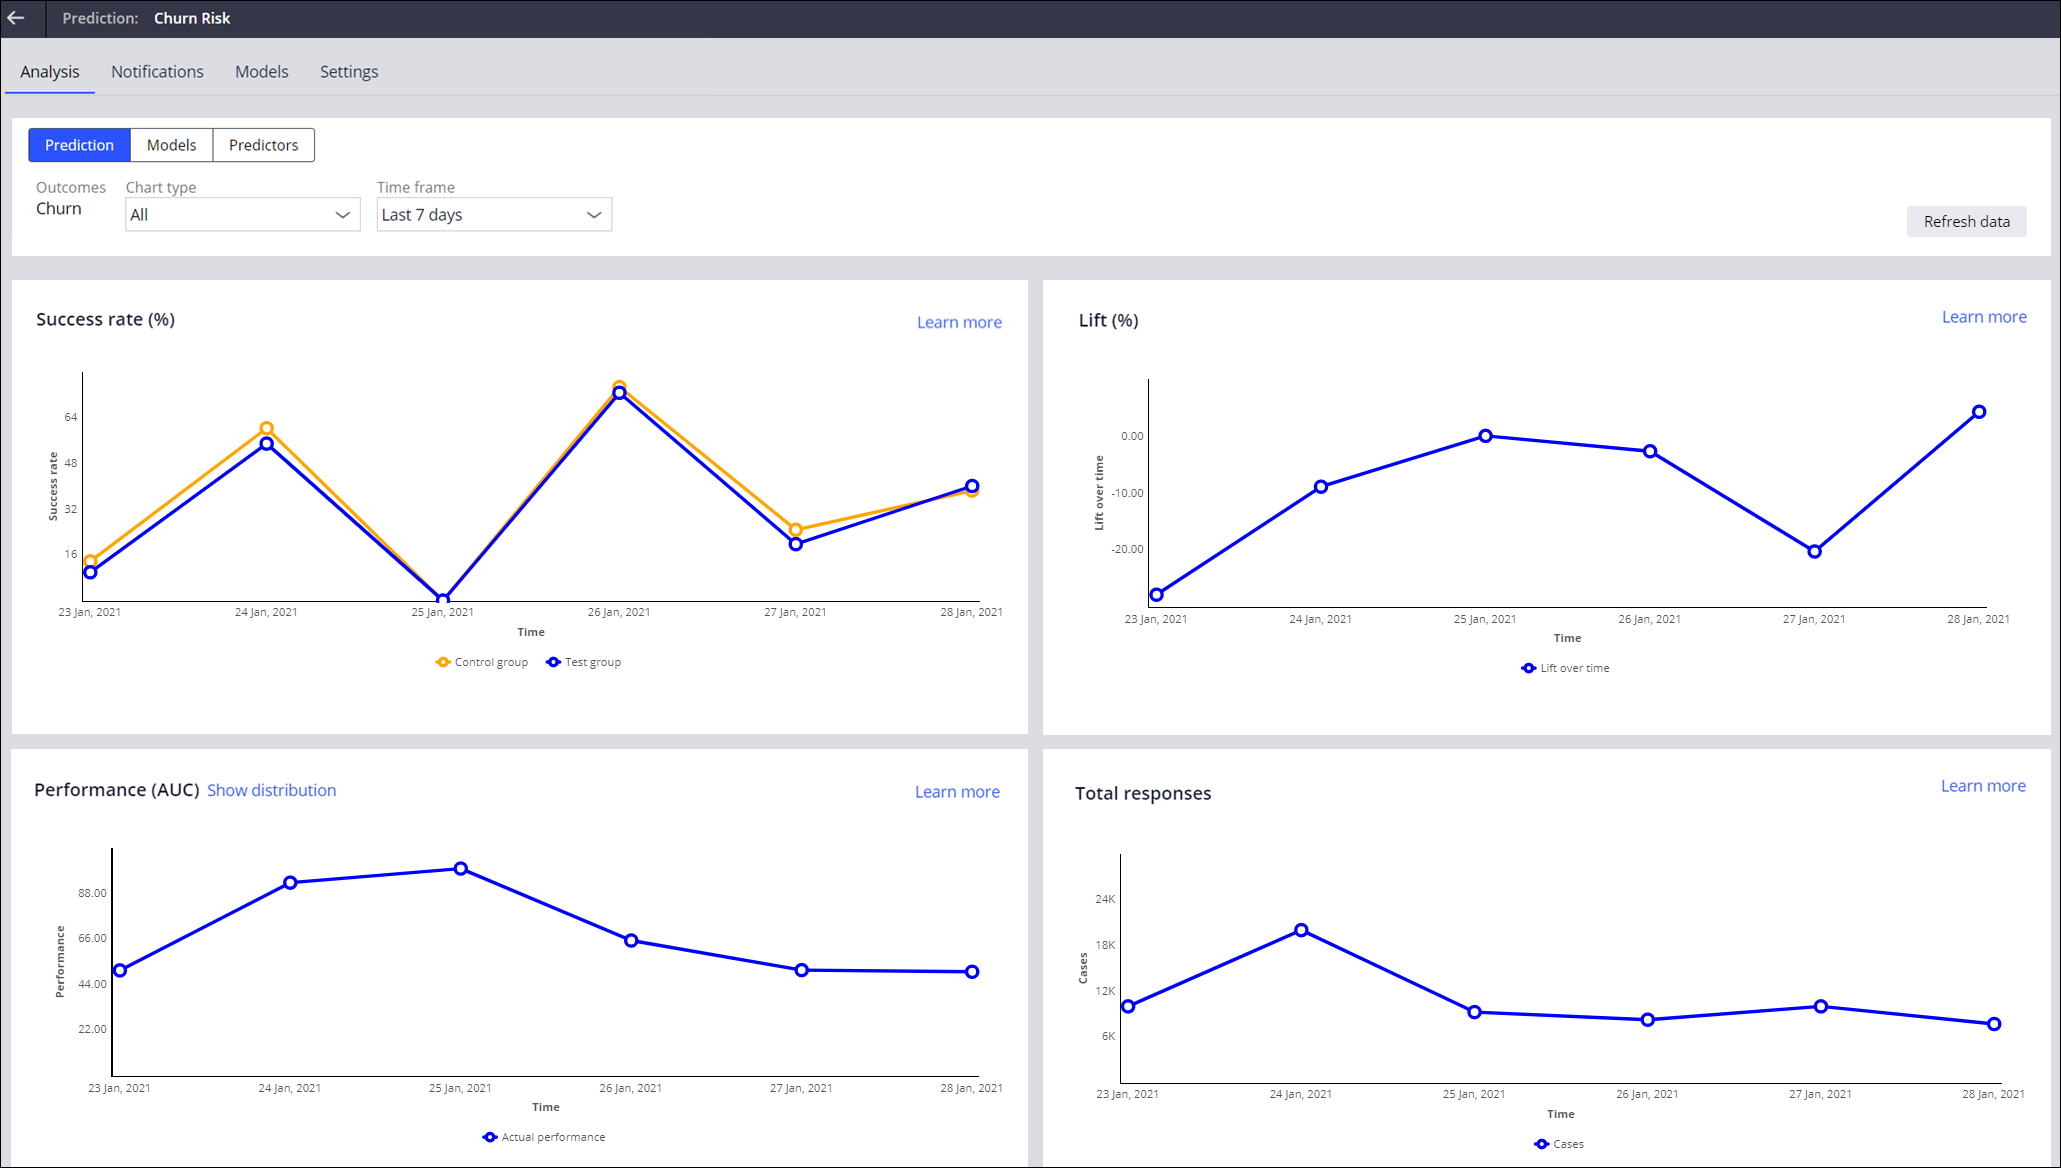
- Performance metrics help you evaluate how effective and accurate the prediction and its models are in predicting outcomes. Performance metrics are based on the feedback, and include the success rate, lift, AUC (Area Under Curve), and total responses.
- Output
- Output metrics are based on the data that models generate, including propensities, numeric output for continuous models, and symbolic output (labels) for binary and categorical models. Output metrics can help you identify issues and improve your models irrespective of responses.
- Predictors (input)
- Predictor metrics are based on model input, such as age, income, location, or current product subscriptions, that models use to predict customer responses or case outcomes. Predictor metrics can help you identify issues and improve your models irrespective of responses.
Pega Customer Decision Hub
- In the navigation pane of Prediction Studio, click Predictions.
- In the list of predictions, open a prediction that you want to analyze.
- Click the Notifications tab, and then review the messages to identify a performance issue that you want to investigate, for example, a sudden drop in the prediction's lift.
- Click the Analysis tab, and then click
Prediction.
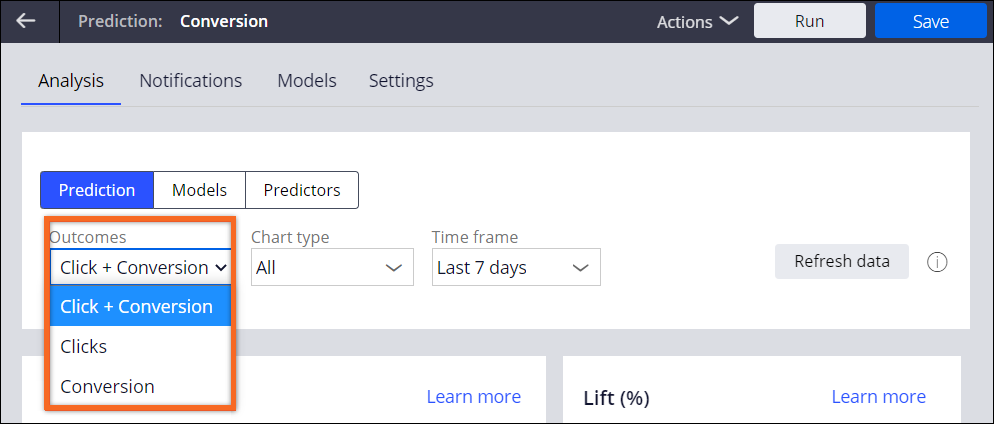
- In the Outcomes list, select the outcome to
analyze.If a prediction predicts a single outcome (single-stage prediction), the outcome is already selected. If a prediction predicts outcomes that occur in a sequence (multistage prediction), you can select each individual outcome or the two outcomes combined.
- In the Chart type list, select the type of data
to focus on:
- To view all available charts, click All.
- To filter for performance charts, click Performance only.
- To filter for output charts, click Output only.
- In the Time frame list, select the period that you want to analyze.
- On the charts, look for any declines in performance and other anomalies
in model behavior.
- In the Outcomes list, select the outcome to
analyze.
- Review a model that has poor performance or displays unexpected behavior:
- Click the Notifications tab, and then filter for
messages for that model.
- Click the Analysis tab, and then click Models.
- If the prediction uses more that one model, in the Models list, select the model that you want to investigate.
- In the Time frame list, select the period that you want to analyze.
- Review the model charts that are relevant to the issue that you are investigating.
- Click the Notifications tab, and then filter for
messages for that model.
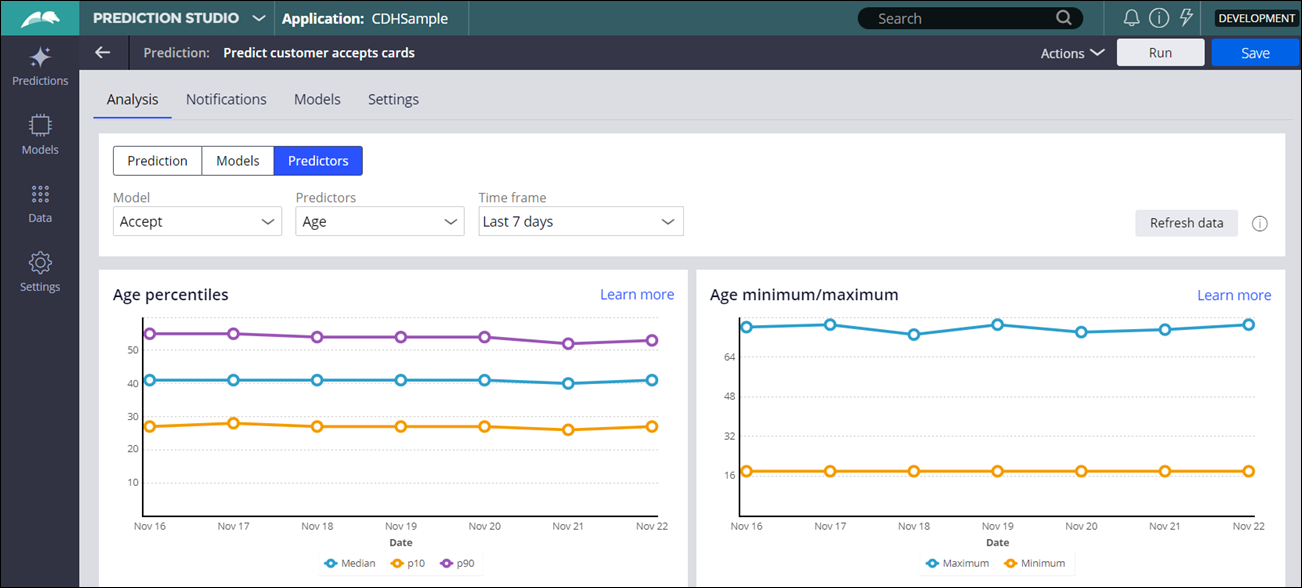
- Review issues related to predictors:
- Click the Notifications tab, and then filter for messages for that model in the predictors category.
- Click the Predictors tab.
- In the Model list, select a model that you want to investigate.
- In the Predictor list, select a predictor for the associated model.
- In the Time frame list, select the period that
you want to analyze.
Predictor charts in a prediction 
- Optional: To refresh the charts with the latest data, in the header of the prediction, click Refresh data.
Previous topic Customizing predictions Next topic Prediction analysis charts


